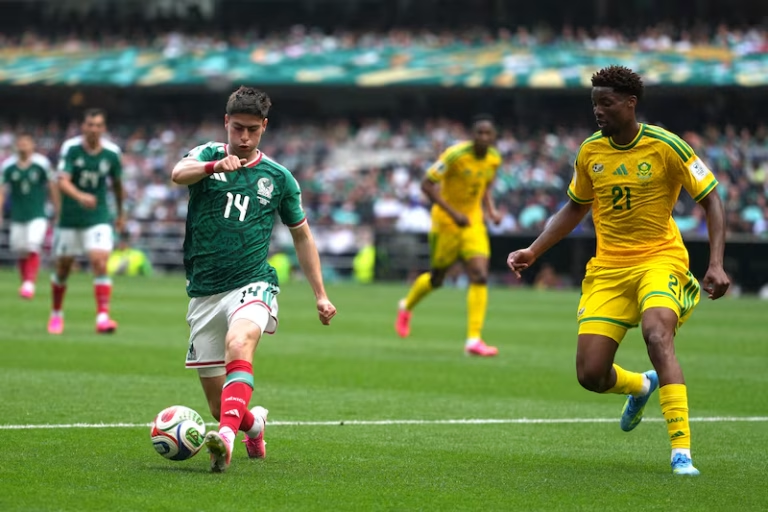
The expanded FIFA World Cup creates a demanding environment for live analysis. With 48 teams, 104 matches and contrasting tactical systems, the score alone rarely tells the complete story.
InplayRadar’s World Cup data hub brings live xG, momentum, dangerous attacks and automated signals into one interface so that multiple fixtures can be followed consistently.
Separating chance quantity from quality
Expected goals estimates the quality of a scoring opportunity by considering factors such as shot location, angle and the way the chance was created.
A close-range attempt in the centre of the penalty area normally carries more significance than several speculative shots from distance.
InplayRadar extends this idea through RXG, its chance-quality indicator calibrated with details including shot angle, distance, body part and pre-assist quality.
This is designed to reveal situations in which the scoreline hides the quality of the opportunities a team has accumulated.
Reading pressure between the chances
xG describes chance quality, but it cannot fully show how pressure changes between shots. InplayRadar’s rolling pressure measurement evaluates penalty-area entries, shot density and directional activity over recent periods.
Its momentum view can therefore distinguish an isolated opportunity from a sustained attacking phase.
A source of World Cup live match data becomes particularly useful when group-stage fixtures overlap. Instead of comparing separate score pages manually, analysts can view match cards containing the score, minute, xG, momentum, dangerous attacks, shots and corners, then open detailed graphs for the most relevant games.
Six analytical perspectives
InplayRadar uses six specialised AI bots rather than treating every match pattern as the same problem. ROBIN.AI examines odds movement with pitch pressure. PERSIE.AI focuses on first-half xG and attacking activity.
MACY.AI evaluates the change from half-time into the second half. BERG.AI concentrates on xG quality, LUCKY.AI follows corner pressure and wing activity, and SALA.AI monitors sharp movement in first-half markets.
The platform can send triggered observations to Telegram and records their outcomes in Signal History.
Bot Performance allows users to compare the systems over daily, weekly and monthly periods rather than judging an analytical method from a single match.
Context remains essential
Red cards, substitutions, fatigue and tournament game state can change the interpretation of every metric. A leading team may reduce its attacking activity and defend compactly, while the trailing side takes greater risks. No model can guarantee what happens next.
The advantage of combining live xG, momentum and specialised scanning is not certainty. It is a clearer view of how chance quality, pressure and tactical events interact. That turns World Cup coverage from isolated statistics into a continuous account of match dynamics.