

Blue Jays vs Diamondbacks Live Score (19 Apr, 2026)
Game Information
Stage
Standard
Season
2026
First Pitch
Sun, Apr 19, 4:10 pm
Venue
Chase Field
Location
Phoenix, Arizona
Attendance
32,240
Live Situation
0Balls
2Strikes
0Outs
—Pitcher
—At Bat
Pitch Sequence
1
STRIKE FOUL
Cutter
92 MPH
2
STRIKE SWINGING
Four-seam FB
95 MPH
3
BALL IN PLAY
Four-seam FB
96 MPH
Injury Report







Team Stats
 TOR
ARI


10
Runs
4
14
Hits
10
0
Errors
0
1
Home Runs
1
4
Walks
1
7
Strikeouts
5
Player Box Score
Toronto Blue Jays
| Player | H-AB | AB | R | H | RBI | HR | BB | K | #P | AVG | OBP | SLG |
|---|---|---|---|---|---|---|---|---|---|---|---|---|
 Nathan Lukes | 3-5 | 5 | 1 | 3 | 3 | 0 | 0 | 0 | 18 | .214 | .244 | .262 |
 Ernie Clement | 2-5 | 5 | 1 | 2 | 0 | 0 | 0 | 0 | 16 | .302 | .310 | .407 |
 Vladimir Guerrero Jr. | 3-5 | 5 | 2 | 3 | 2 | 0 | 0 | 1 | 14 | .333 | .429 | .436 |
 Jesus Sanchez | 1-4 | 4 | 1 | 1 | 0 | 0 | 1 | 0 | 15 | .262 | .315 | .400 |
 Eloy Jimenez | 1-4 | 4 | 1 | 1 | 1 | 0 | 1 | 1 | 17 | .313 | .389 | .313 |
 Andres Gimenez | 1-4 | 4 | 1 | 1 | 1 | 0 | 0 | 0 | 15 | .273 | .305 | .455 |
 Kazuma Okamoto | 2-4 | 4 | 2 | 2 | 3 | 1 | 1 | 2 | 20 | .221 | .294 | .364 |
 Myles Straw | 0-3 | 3 | 1 | 0 | 0 | 0 | 1 | 1 | 17 | .346 | .393 | .500 |
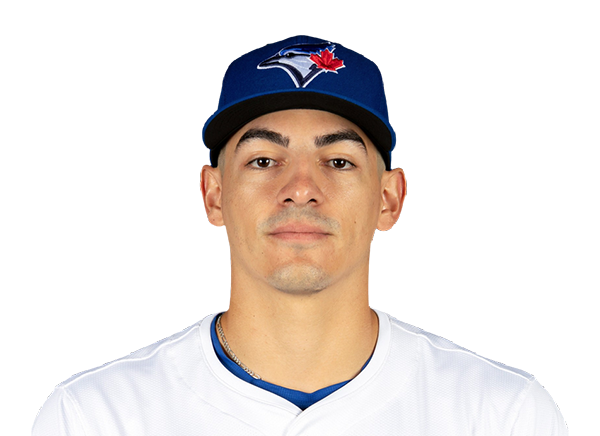 Brandon Valenzuela | 1-4 | 4 | 0 | 1 | 0 | 0 | 0 | 2 | 15 | .185 | .214 | .296 |
Arizona Diamondbacks
| Player | H-AB | AB | R | H | RBI | HR | BB | K | #P | AVG | OBP | SLG |
|---|---|---|---|---|---|---|---|---|---|---|---|---|
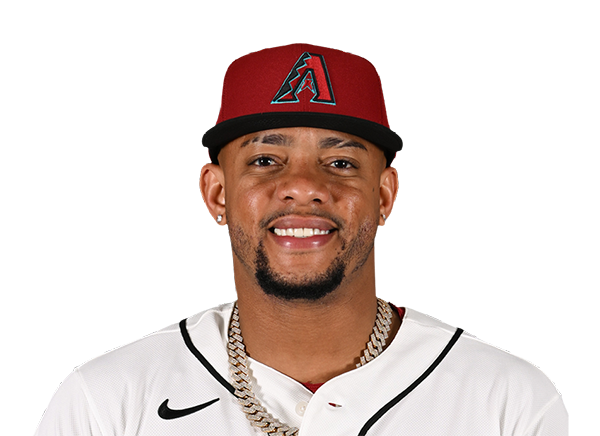 Ketel Marte | 1-4 | 4 | 1 | 1 | 0 | 0 | 0 | 0 | 14 | .217 | .278 | .386 |
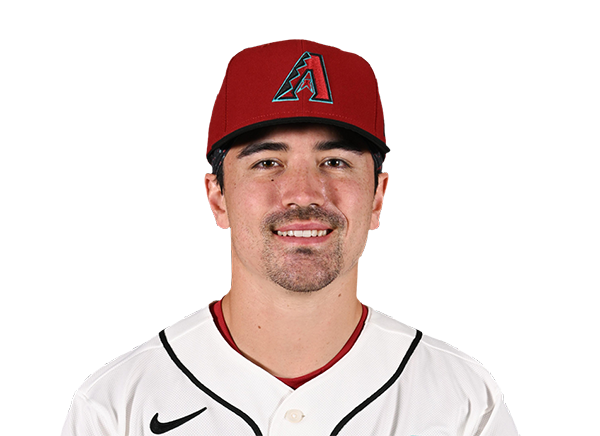 Corbin Carroll | 0-2 | 2 | 0 | 0 | 0 | 0 | 0 | 1 | 6 | .300 | .390 | .600 |
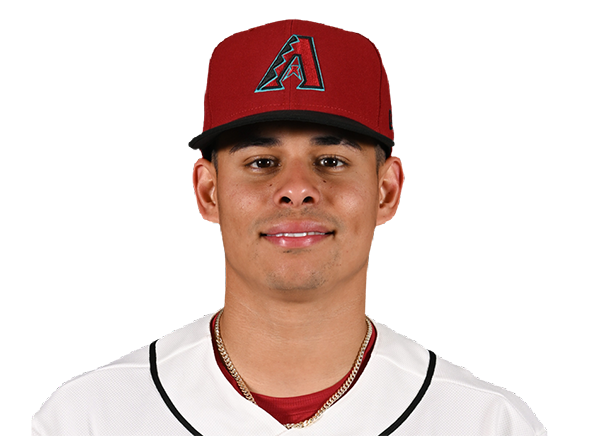 Jorge Barrosa | 1-2 | 2 | 1 | 1 | 2 | 1 | 0 | 0 | 11 | .240 | .283 | .480 |
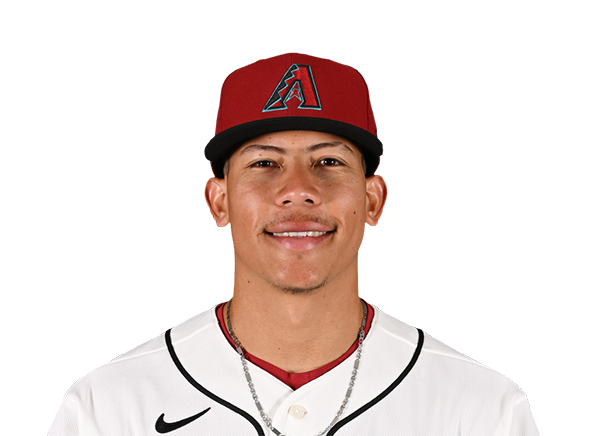 Jose Fernandez | 1-4 | 4 | 0 | 1 | 0 | 0 | 0 | 1 | 12 | .300 | .300 | .433 |
 Lourdes Gurriel Jr. | 1-4 | 4 | 1 | 1 | 0 | 0 | 0 | 0 | 14 | .125 | .125 | .125 |
 Aramis Garcia | 0-0 | 0 | 0 | 0 | 0 | 0 | 0 | 0 | 0 | .000 | .000 | .000 |
 Adrian Del Castillo | 2-3 | 3 | 1 | 2 | 1 | 0 | 1 | 0 | 11 | .303 | .324 | .455 |
 Ildemaro Vargas | 1-4 | 4 | 0 | 1 | 0 | 0 | 0 | 1 | 12 | .368 | .390 | .596 |
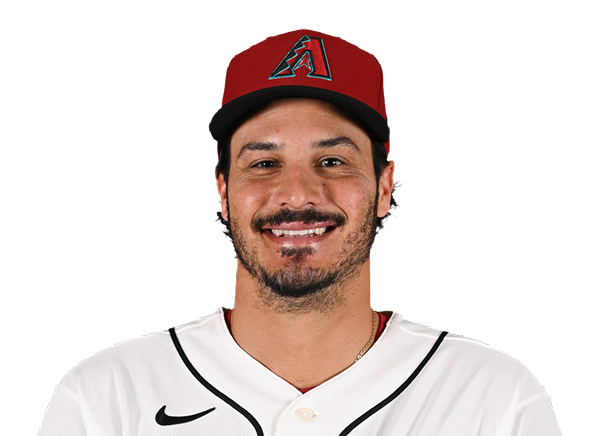 Nolan Arenado | 0-3 | 3 | 0 | 0 | 0 | 0 | 0 | 1 | 12 | .205 | .213 | .342 |
 Tim Tawa | 1-1 | 1 | 0 | 1 | 0 | 0 | 0 | 0 | 5 | .139 | .238 | .194 |
 James McCann | 1-4 | 4 | 0 | 1 | 1 | 0 | 0 | 1 | 16 | .250 | .273 | .344 |
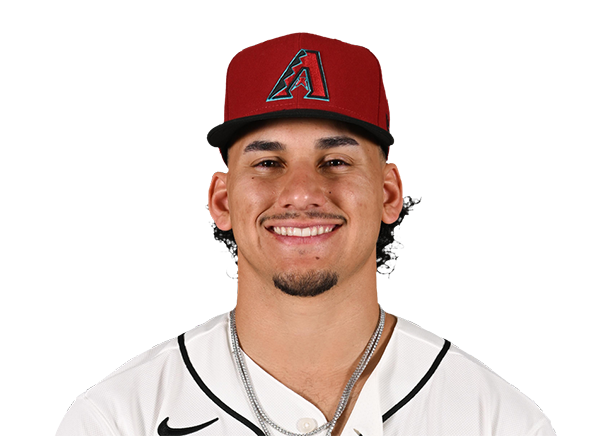 Alek Thomas | 1-4 | 4 | 0 | 1 | 0 | 0 | 0 | 0 | 10 | .164 | .203 | .279 |
Toronto Blue Jays
| Player | IP | H | R | ER | BB | K | HR | PC-ST | ERA | PC |
|---|---|---|---|---|---|---|---|---|---|---|
 Kevin Gausman | 6.0 | 7 | 2 | 2 | 1 | 4 | 0 | 86-54 | 2.54 | 86 |
 Mason Fluharty | 1.0 | 2 | 2 | 2 | 0 | 1 | 1 | 18-12 | 6.75 | 18 |
 Tommy Nance | 1.0 | 0 | 0 | 0 | 0 | 0 | 0 | 8-7 | 6.23 | 8 |
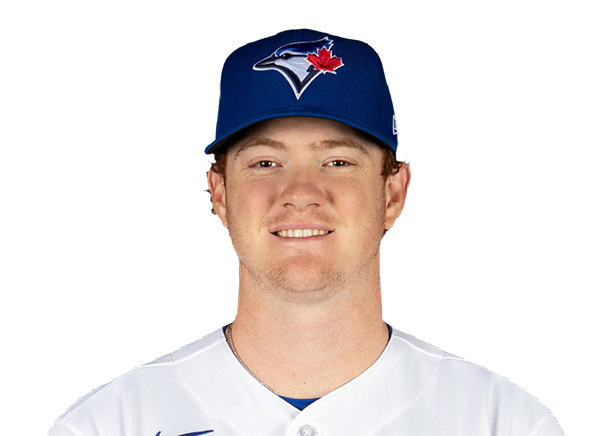 Braydon Fisher | 1.0 | 1 | 0 | 0 | 0 | 0 | 0 | 11-8 | 0.77 | 11 |
Arizona Diamondbacks
| Player | IP | H | R | ER | BB | K | HR | PC-ST | ERA | PC |
|---|---|---|---|---|---|---|---|---|---|---|
 Ryne Nelson | 0.1 | 8 | 8 | 8 | 1 | 1 | 0 | 30-19 | 6.97 | 30 |
 Andrew Hoffmann | 2.1 | 2 | 1 | 1 | 1 | 3 | 1 | 33-20 | 1.74 | 33 |
 Brandon Pfaadt | 6.1 | 4 | 1 | 1 | 2 | 3 | 0 | 84-55 | 4.70 | 84 |
H2H / Season Series
ARI4–10
TOR
ARI6–2
TOR
ARI6–3
TOR
Last 5 Games
| Date | Opponent | Result |
|---|---|---|
| Aug 22 |  @ NYY | W4–3 |
| Aug 21 | @ NYY | L1–3 |
| Aug 20 |  @ TB | W5–1 |
| Aug 19 | @ TB | L6–7 |
| Aug 18 | @ TB | W10–5 |
| Date | Opponent | Result |
|---|---|---|
| Aug 22 |  vs CIN | L5–11 |
| Aug 21 | vs CIN | W9–0 |
| Aug 19 |  @ BOS | W7–6 |
| Aug 18 | @ BOS | L4–9 |
| Aug 17 | @ BOS | L1–11 |
Standings
American League
| Team | W | L | PCT | GB | DIFF | STRK |
|---|---|---|---|---|---|---|
| 1Rays | 76 | 53 | .589 | - | +42 | L3 |
2 White Sox | 67 | 61 | .523 | 8.5 | +47 | W1 |
3 Astros | 65 | 64 | .504 | 11 | -42 | W1 |
| 4Yankees | 73 | 56 | .566 | 3 | +95 | L1 |
| 5Red Sox | 69 | 59 | .539 | 6.5 | +97 | W1 |
6 Rangers | 64 | 66 | .492 | 12.5 | -48 | L1 |
| 7Blue Jays | 64 | 67 | .489 | 13 | -50 | W1 |
8 Twins | 63 | 66 | .488 | 13 | -45 | L1 |
9 Guardians | 63 | 66 | .488 | 13 | -15 | W2 |
10 Orioles | 63 | 67 | .485 | 13.5 | -33 | W2 |
11 Mariners | 62 | 68 | .477 | 14.5 | -44 | W2 |
12 Tigers | 61 | 68 | .473 | 15 | +77 | L4 |
13 Royals | 57 | 74 | .435 | 20 | -95 | W7 |
14 Angels | 52 | 78 | .400 | 24.5 | -68 | W1 |
15 Athletics | 49 | 80 | .380 | 27 | -189 | L5 |
National League
| Team | W | L | PCT | GB | DIFF | STRK |
|---|---|---|---|---|---|---|
1 Brewers | 81 | 49 | .623 | - | +163 | W3 |
2 Dodgers | 78 | 51 | .605 | 2.5 | +146 | W4 |
3 Braves | 75 | 55 | .577 | 6 | +108 | L2 |
4 Cubs | 74 | 56 | .569 | 7 | +98 | L3 |
5 Phillies | 72 | 58 | .554 | 9 | +25 | W8 |
6 Padres | 69 | 60 | .535 | 11.5 | +7 | W1 |
| 7Diamondbacks | 68 | 61 | .527 | 12.5 | +13 | W2 |
8 Marlins | 66 | 64 | .508 | 15 | +17 | W2 |
9 Cardinals | 66 | 65 | .504 | 15.5 | 0 | L2 |
10 Pirates | 63 | 67 | .485 | 18 | +30 | L1 |
| 11Reds | 61 | 68 | .473 | 19.5 | -98 | L2 |
12 Nationals | 61 | 70 | .466 | 20.5 | +14 | L3 |
13 Mets | 58 | 71 | .450 | 22.5 | -44 | L1 |
14 Giants | 52 | 76 | .406 | 28 | -78 | L2 |
15 Rockies | 50 | 78 | .391 | 30 | -130 | L4 |
TOR
VS
ARI
Pitchers
Kevin Gausman
Mason Fluharty
Tommy Nance
Braydon Fisher
Catchers
Brandon Valenzuela
Infielders
Ernie Clement
Vladimir Guerrero Jr.
Andres Gimenez
Kazuma Okamoto
Outfielders
Nathan Lukes
Jesus Sanchez
Myles Straw
Designated Hitters
Eloy Jimenez
Pitchers
Ryne Nelson
Andrew Hoffmann
Brandon Pfaadt
Catchers
Aramis Garcia
Infielders
Ketel Marte
Jose Fernandez
Ildemaro Vargas
Nolan Arenado
James McCann
Outfielders
Corbin Carroll
Jorge Barrosa
Lourdes Gurriel Jr.
Tim Tawa
Alek Thomas
Designated Hitters
Adrian Del Castillo
Blue Jays
VS
Diamondbacks
Batting
130
Team Games Played
129
4383
At Bats
4332
1072
Hits
1059
491
Runs Batted In
560
123
Home Runs
127
65
Stolen Bases
89
.245
Batting Average
.244
514
Runs
588
204
Doubles
224
8
Triples
33
1661
Total Bases
1730
358
Walks
436
950
Strikeouts
940
.306
On Base Percentage
.318
.379
Slugging Percentage
.399
.685
OBP Pct + SLG Pct
.717
130
Games Played
129
130
Games Started
129
46
Hit By Pitch
47
0.0
Wins Above Replacement
0.0
0.0
Offensive Wins Above Replacement
0.0
14
Caught Stealing
20
1
Is Qualified
1
511.0
Runs Created
567.7
4.0
Runs Created Per 27 Outs
4.4
.074
Walks Per Plate Appearance
.089
0.38
Walk To Strikeout Ratio
0.46
.134
Isolated Power
.155
.228
Secondary Average
.271
3.80
Pitches Per Plate Appearance
3.94
335
Extra Base Hits
384
4849
Plate Appearances
4889
35.6
At Bats Per Home Run
34.1
20
Sacrifice Hit
32
39
Sacrifice Flies
40
Pitching
130
Team Games Played
129
39
Quality Starts
47
63
Wins
68
67
Losses
61
43
Saves
31
83
Holds
71
1036
Hits
1095
509
Earned runs
527
133
Home Runs
149
474
Walks
376
1127
Strikeouts
873
8.8
Strikeouts Per 9 Innings
6.9
148.9
Pitches Per Start
140.6
1.30
Walks Plus Hits Per Inning Pitched
1.28
3.96
Earned Run Average
4.14
67
Losses
61
1157.1
Innings pitched
1145.0
.485
Win Percentage
.527
58
Save Opportunities
46
.239
Opponent Batting Average
.251
.316
Opponent's On-base pct.
.315
.375
Opponent's Slugging pct.
.415
.690
Opponent's OPB Pct + SLG Pct
.731
4337
At Bats
4358
173
Doubles
217
9
Triples
25
31
Batters Hit
49
123
Stolen Bases
76
130
Games Played
129
1
Complete Games
1
8
Shutouts
8
41
Wild Pitches
26
537
Runs Batted In
560
5
Balks
5
1157.1
Innings pitched
1145.0
8.8
Strikeouts Per 9 Innings
6.9
39
Caught Stealing
17
130
Games Started
129
0.0
Wins Above Replacement
0.0
1
Is Qualified
1
565
Runs
575
509
Earned Runs
527
1626
Total Bases
1809
Fielding
130
Team Games Played
129
1157
Full Innings
1145
4662
Total Chances
4608
3472
Putouts
3435
1111
Assists
1125
79
Errors
48
204
Double Plays
224
0.983
Fielding Percentage
0.990
35.6
Range Factor
35.8
0.0
Zone Rating
0.0
130
Games Played
129
0
Games Started
0
0.0
Defensive Wins Above Replacement
0.0
1
Qualified
1