

Orioles vs Blue Jays Live Score (7 Jun, 2026)
Game Information
Stage
Standard
Season
2026
First Pitch
Sun, Jun 7, 1:37 pm
Venue
Rogers Centre
Location
Toronto, Ontario
Attendance
41,278
Live Situation
0Balls
3Strikes
0Outs
—Pitcher
—At Bat
Pitch Sequence
1
STRIKE SWINGING
Knuckle Curve
87 MPH
2
STRIKE SWINGING
Knuckle Curve
87 MPH
3
STRIKE LOOKING
Four-seam FB
98 MPH
Injury Report
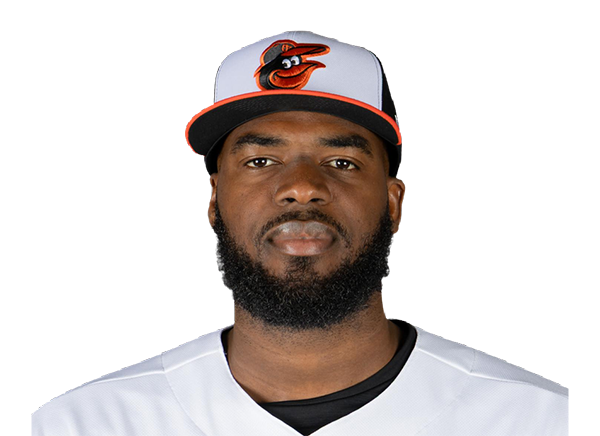
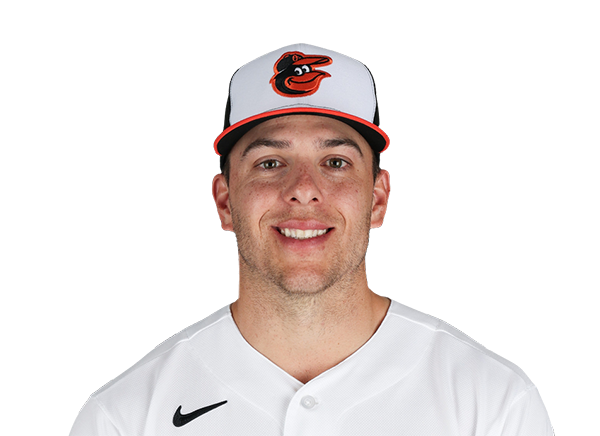


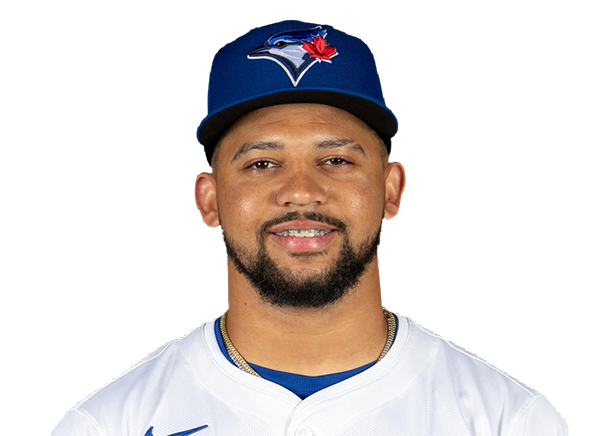
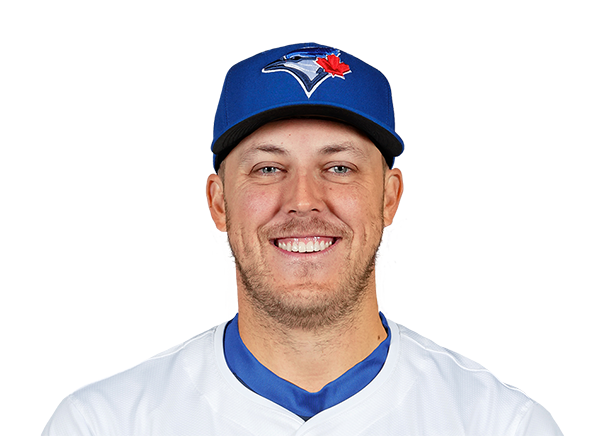

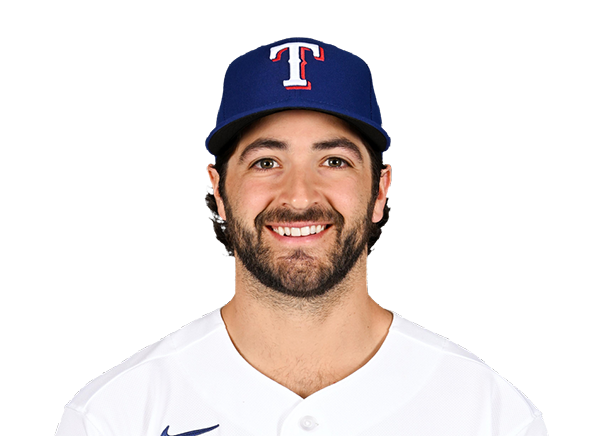
Team Stats
 BAL
TOR


4
Runs
6
8
Hits
10
1
Errors
0
2
Home Runs
2
2
Walks
1
10
Strikeouts
5
Player Box Score
Baltimore Orioles
| Player | H-AB | AB | R | H | RBI | HR | BB | K | #P | AVG | OBP | SLG |
|---|---|---|---|---|---|---|---|---|---|---|---|---|
 Taylor Ward | 1-4 | 4 | 1 | 1 | 2 | 1 | 0 | 0 | 15 | .255 | .396 | .360 |
 Gunnar Henderson | 0-4 | 4 | 0 | 0 | 0 | 0 | 0 | 2 | 21 | .222 | .279 | .418 |
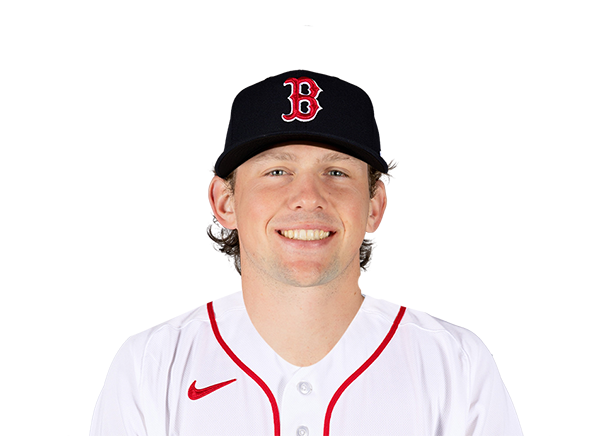 Adley Rutschman | 1-4 | 4 | 0 | 1 | 0 | 0 | 0 | 1 | 20 | .267 | .343 | .489 |
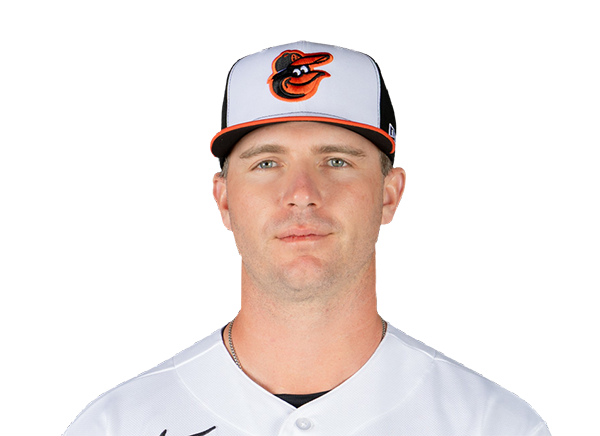 Pete Alonso | 0-3 | 3 | 0 | 0 | 0 | 0 | 1 | 0 | 16 | .243 | .324 | .446 |
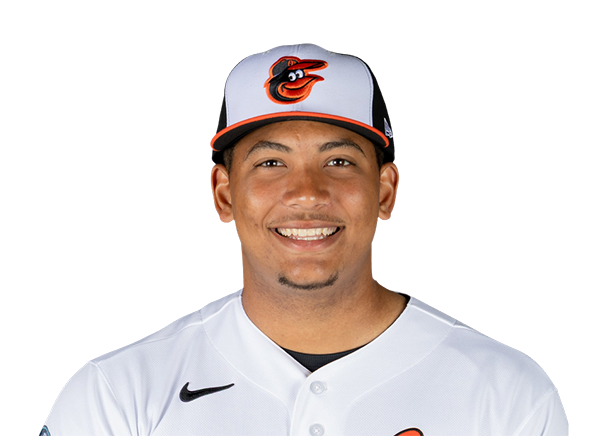 Samuel Basallo | 0-3 | 3 | 0 | 0 | 0 | 0 | 0 | 2 | 12 | .267 | .332 | .483 |
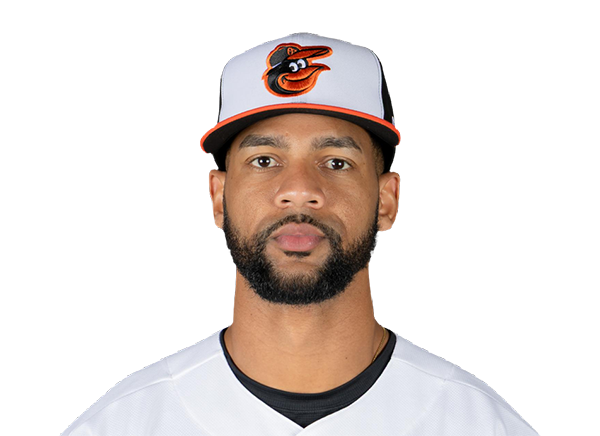 Leody Taveras | 0-1 | 1 | 0 | 0 | 0 | 0 | 0 | 1 | 4 | .258 | .349 | .368 |
 Sam Huff | 0-0 | 0 | 0 | 0 | 0 | 0 | 0 | 0 | 0 | .222 | .222 | .333 |
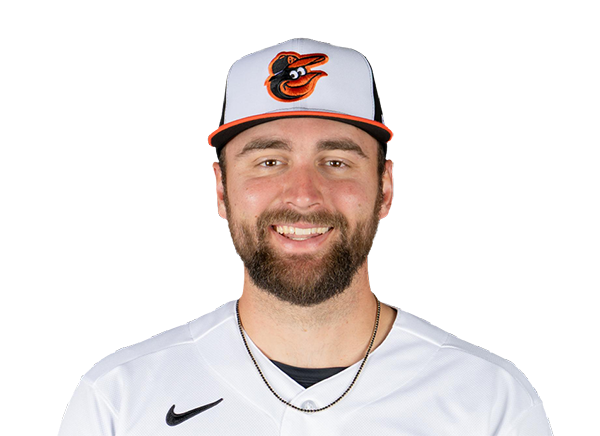 Colton Cowser | 2-4 | 4 | 1 | 2 | 1 | 1 | 0 | 1 | 19 | .244 | .324 | .409 |
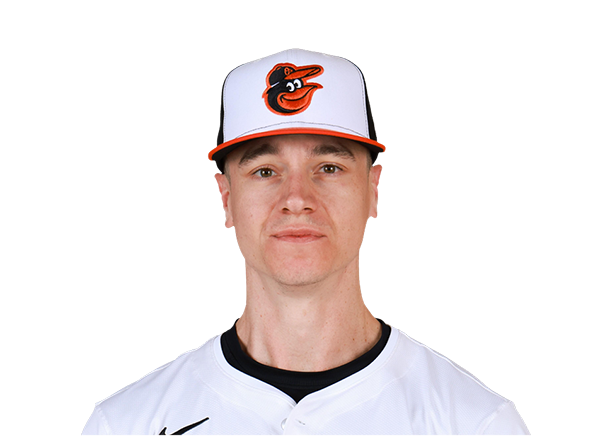 Tyler O'Neill | 1-4 | 4 | 0 | 1 | 0 | 0 | 0 | 1 | 11 | .162 | .267 | .229 |
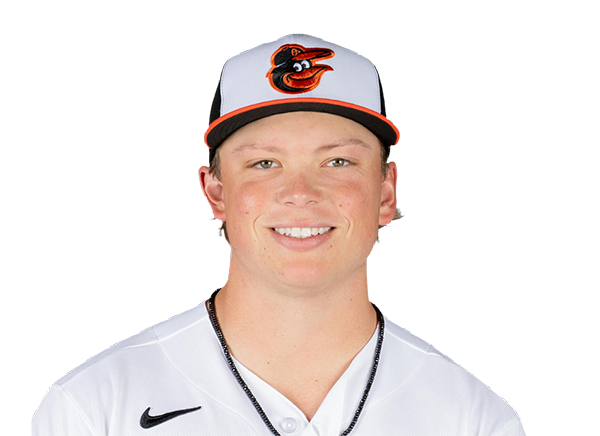 Jackson Holliday | 1-3 | 3 | 1 | 1 | 0 | 0 | 1 | 1 | 19 | .224 | .328 | .408 |
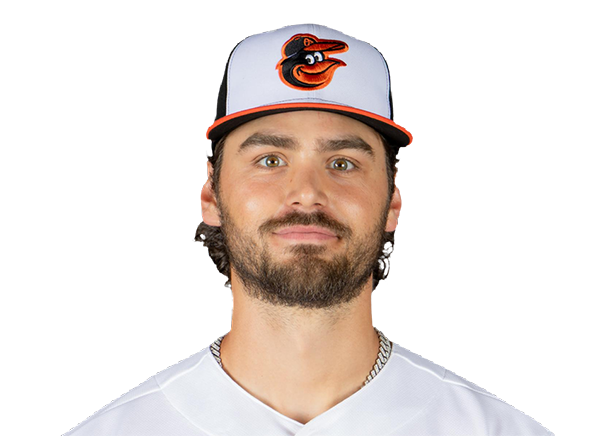 Blaze Alexander | 2-4 | 4 | 1 | 2 | 1 | 0 | 0 | 1 | 18 | .277 | .329 | .394 |
Toronto Blue Jays
| Player | H-AB | AB | R | H | RBI | HR | BB | K | #P | AVG | OBP | SLG |
|---|---|---|---|---|---|---|---|---|---|---|---|---|
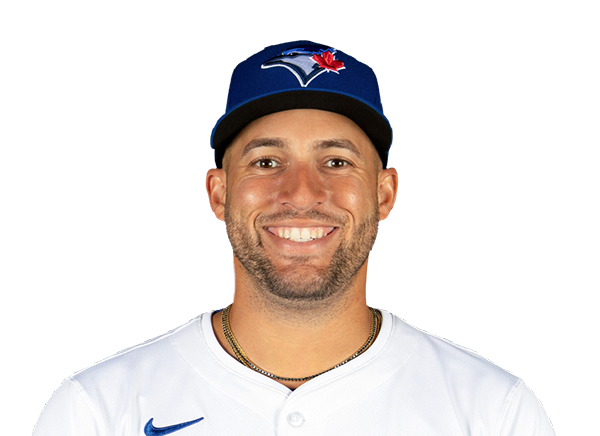 George Springer | 0-4 | 4 | 0 | 0 | 0 | 0 | 0 | 0 | 9 | .207 | .289 | .351 |
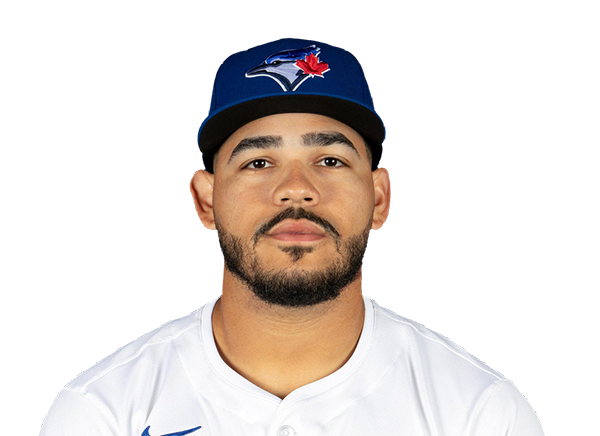 Yohendrick Pinango | 2-4 | 4 | 1 | 2 | 1 | 1 | 0 | 0 | 20 | .301 | .333 | .456 |
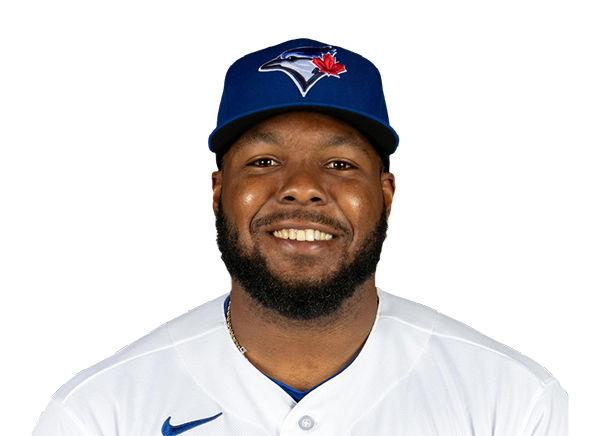 Vladimir Guerrero Jr. | 0-4 | 4 | 0 | 0 | 0 | 0 | 0 | 1 | 12 | .287 | .378 | .374 |
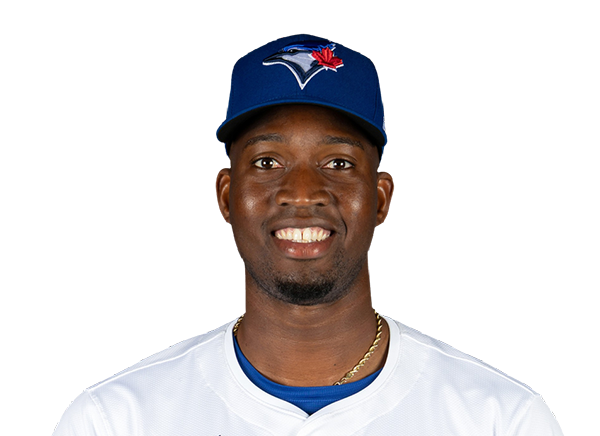 Jesus Sanchez | 2-4 | 4 | 1 | 2 | 0 | 0 | 0 | 1 | 11 | .288 | .322 | .451 |
 Daulton Varsho | 0-0 | 0 | 0 | 0 | 0 | 0 | 0 | 0 | 0 | .256 | .331 | .408 |
 Ernie Clement | 1-4 | 4 | 1 | 1 | 0 | 0 | 0 | 1 | 11 | .306 | .326 | .460 |
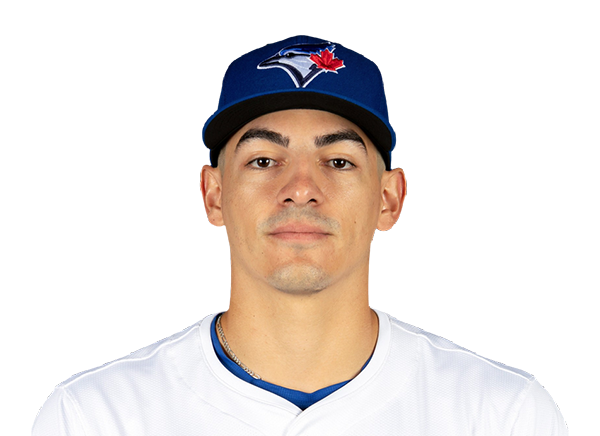 Brandon Valenzuela | 1-3 | 3 | 1 | 1 | 2 | 1 | 1 | 1 | 16 | .256 | .343 | .479 |
 Kazuma Okamoto | 1-4 | 4 | 1 | 1 | 1 | 0 | 0 | 1 | 18 | .235 | .316 | .432 |
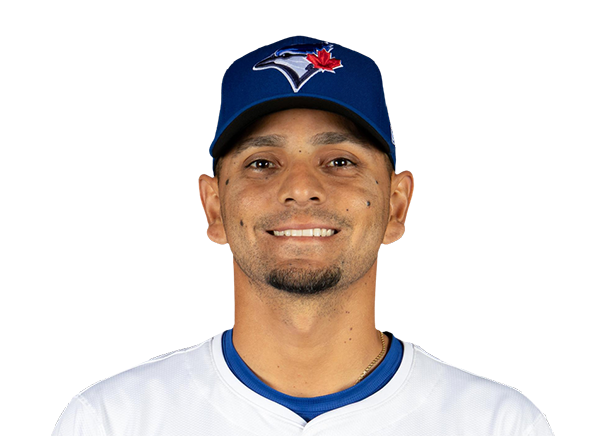 Andres Gimenez | 2-4 | 4 | 1 | 2 | 1 | 0 | 0 | 0 | 17 | .224 | .267 | .357 |
 Myles Straw | 0-2 | 2 | 0 | 0 | 0 | 0 | 0 | 0 | 4 | .232 | .300 | .323 |
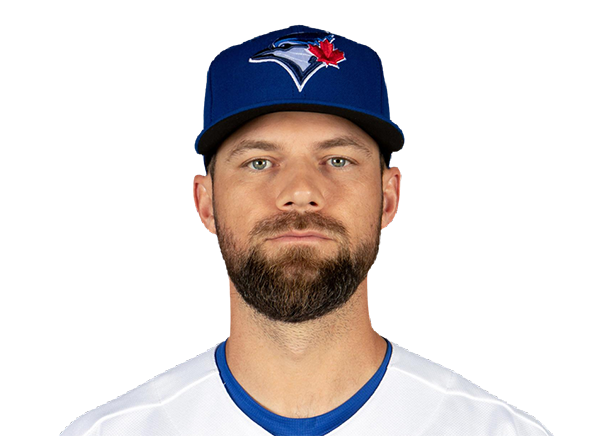 Nathan Lukes | 1-2 | 2 | 0 | 1 | 1 | 0 | 0 | 0 | 10 | .316 | .365 | .411 |
Baltimore Orioles
| Player | IP | H | R | ER | BB | K | HR | PC-ST | ERA | PC |
|---|---|---|---|---|---|---|---|---|---|---|
 Shane Baz | 5.2 | 7 | 5 | 1 | 1 | 3 | 1 | 81-56 | 4.09 | 81 |
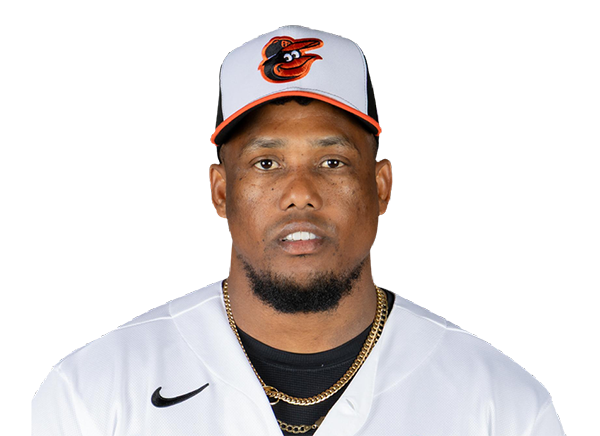 Yennier Cano | 0.1 | 1 | 0 | 0 | 0 | 0 | 0 | 10-6 | 2.53 | 10 |
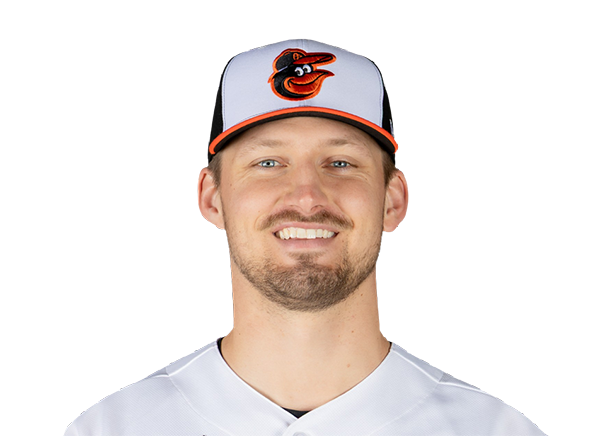 Grant Wolfram | 0.2 | 1 | 0 | 0 | 0 | 1 | 0 | 17-11 | 3.50 | 17 |
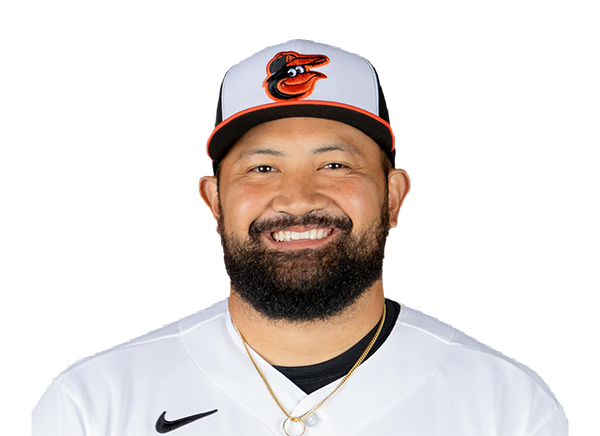 Rico Garcia | 0.2 | 1 | 1 | 1 | 0 | 1 | 1 | 13-9 | 1.00 | 13 |
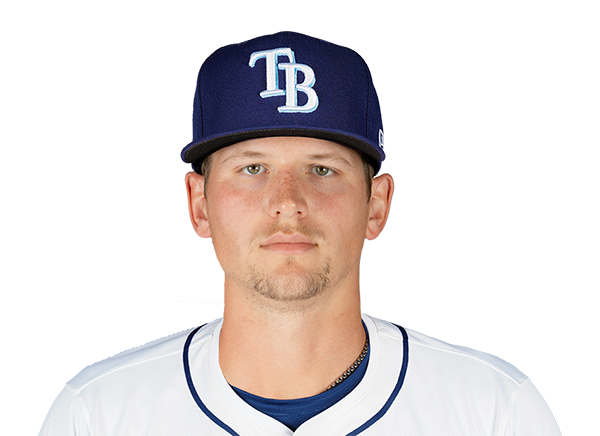 Tyler Wells | 0.2 | 0 | 0 | 0 | 0 | 0 | 0 | 7-6 | 4.03 | 7 |
Toronto Blue Jays
| Player | IP | H | R | ER | BB | K | HR | PC-ST | ERA | PC |
|---|---|---|---|---|---|---|---|---|---|---|
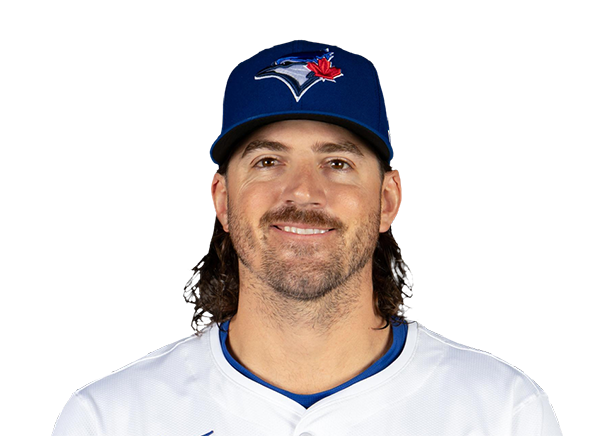 Kevin Gausman | 5.0 | 5 | 4 | 4 | 0 | 5 | 2 | 93-58 | 3.60 | 93 |
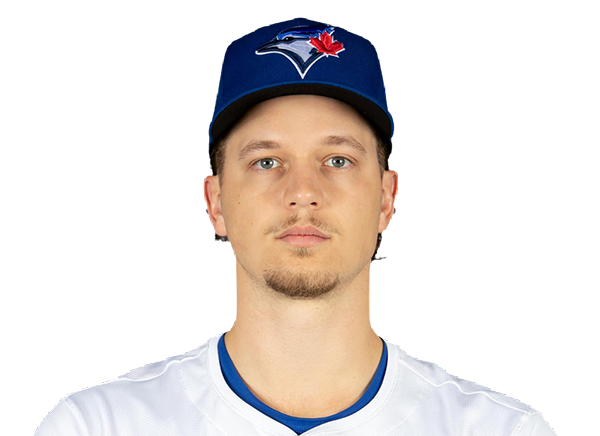 Adam Macko | 1.0 | 1 | 0 | 0 | 0 | 2 | 0 | 18-12 | 1.64 | 18 |
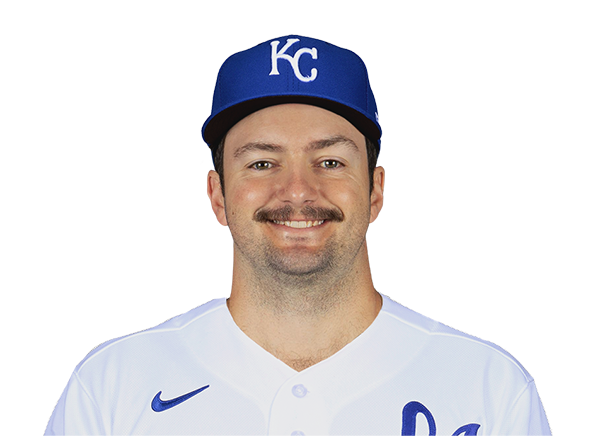 Connor Seabold | 0.1 | 1 | 0 | 0 | 1 | 0 | 0 | 10-5 | 4.26 | 10 |
 Tyler Rogers | 1.1 | 0 | 0 | 0 | 1 | 1 | 0 | 17-9 | 2.10 | 17 |
 Louis Varland | 1.1 | 1 | 0 | 0 | 0 | 2 | 0 | 17-13 | 0.26 | 17 |
H2H / Season Series
TOR6–4
BAL
TOR6–4
BAL
TOR3–13
BAL
BAL9–5
TOR
BAL6–5
TOR
BAL5–6
TOR
BAL1–2
TOR
TOR2–3
BAL
BAL0–1
TOR
Last 5 Games
| Date | Opponent | Result |
|---|---|---|
| Aug 21 |  vs TB | W5–3 |
| Aug 20 |  vs NYY | L1–6 |
| Aug 19 | vs NYY | L3–5 |
| Aug 18 | vs NYY | L1–3 |
| Aug 17 | @ TB | L6–7 |
| Date | Opponent | Result |
|---|---|---|
| Aug 22 | @ NYY | W4–3 |
| Aug 21 | @ NYY | L1–3 |
| Aug 20 | @ TB | W5–1 |
| Aug 19 | @ TB | L6–7 |
| Aug 18 | @ TB | W10–5 |
Standings
American League
| Team | W | L | PCT | GB | DIFF | STRK |
|---|---|---|---|---|---|---|
| 1Rays | 76 | 52 | .594 | - | +43 | L2 |
2 White Sox | 67 | 61 | .523 | 9 | +47 | W1 |
3 Astros | 65 | 64 | .504 | 11.5 | -42 | W1 |
| 4Yankees | 73 | 56 | .566 | 3.5 | +95 | L1 |
5 Red Sox | 69 | 59 | .539 | 7 | +97 | W1 |
6 Rangers | 64 | 65 | .496 | 12.5 | -45 | W2 |
| 7Blue Jays | 64 | 67 | .489 | 13.5 | -50 | W1 |
8 Twins | 63 | 66 | .488 | 13.5 | -45 | L1 |
9 Guardians | 63 | 66 | .488 | 13.5 | -15 | W2 |
| 10Orioles | 62 | 67 | .481 | 14.5 | -34 | W1 |
11 Tigers | 61 | 67 | .477 | 15 | +79 | L3 |
12 Mariners | 61 | 68 | .473 | 15.5 | -45 | W1 |
13 Royals | 56 | 74 | .431 | 21 | -97 | W6 |
14 Angels | 51 | 78 | .395 | 25.5 | -71 | L1 |
15 Athletics | 49 | 80 | .380 | 27.5 | -189 | L5 |
National League
| Team | W | L | PCT | GB | DIFF | STRK |
|---|---|---|---|---|---|---|
1 Brewers | 81 | 49 | .623 | - | +163 | W3 |
2 Dodgers | 78 | 51 | .605 | 2.5 | +146 | W4 |
3 Braves | 75 | 55 | .577 | 6 | +108 | L2 |
4 Cubs | 74 | 55 | .574 | 6.5 | +99 | L2 |
5 Phillies | 72 | 58 | .554 | 9 | +25 | W8 |
6 Padres | 69 | 60 | .535 | 11.5 | +7 | W1 |
7 Diamondbacks | 68 | 61 | .527 | 12.5 | +13 | W2 |
8 Marlins | 66 | 64 | .508 | 15 | +17 | W2 |
9 Cardinals | 66 | 65 | .504 | 15.5 | 0 | L2 |
10 Pirates | 63 | 67 | .485 | 18 | +30 | L1 |
11 Reds | 61 | 68 | .473 | 19.5 | -98 | L2 |
12 Nationals | 61 | 70 | .466 | 20.5 | +14 | L3 |
13 Mets | 58 | 71 | .450 | 22.5 | -44 | L1 |
14 Giants | 52 | 76 | .406 | 28 | -78 | L2 |
15 Rockies | 50 | 78 | .391 | 30 | -130 | L4 |
BAL
VS
TOR
Pitchers
Shane Baz
Yennier Cano
Grant Wolfram
Rico Garcia
Tyler Wells
Catchers
Samuel Basallo
Sam Huff
Infielders
Gunnar Henderson
Pete Alonso
Jackson Holliday
Blaze Alexander
Outfielders
Taylor Ward
Colton Cowser
Tyler O'Neill
Designated Hitters
Adley Rutschman
Other Players
Leody Taveras
Pitchers
Kevin Gausman
Adam Macko
Connor Seabold
Tyler Rogers
Louis Varland
Catchers
Brandon Valenzuela
Infielders
Vladimir Guerrero Jr.
Ernie Clement
Kazuma Okamoto
Andres Gimenez
Outfielders
Yohendrick Pinango
Jesus Sanchez
Daulton Varsho
Myles Straw
Nathan Lukes
Designated Hitters
George Springer
Orioles
VS
Blue Jays
Batting
129
Team Games Played
130
4283
At Bats
4383
1010
Hits
1072
559
Runs Batted In
491
157
Home Runs
123
68
Stolen Bases
65
.236
Batting Average
.245
579
Runs
514
185
Doubles
204
18
Triples
8
1702
Total Bases
1661
490
Walks
358
1188
Strikeouts
950
.319
On Base Percentage
.306
.397
Slugging Percentage
.379
.716
OBP Pct + SLG Pct
.685
129
Games Played
130
129
Games Started
130
48
Hit By Pitch
46
0.0
Wins Above Replacement
0.0
0.0
Offensive Wins Above Replacement
0.0
29
Caught Stealing
14
1
Is Qualified
1
551.4
Runs Created
511.0
4.3
Runs Created Per 27 Outs
4.0
.101
Walks Per Plate Appearance
.074
0.41
Walk To Strikeout Ratio
0.38
.162
Isolated Power
.134
.285
Secondary Average
.228
4.00
Pitches Per Plate Appearance
3.80
360
Extra Base Hits
335
4871
Plate Appearances
4849
27.3
At Bats Per Home Run
35.6
16
Sacrifice Hit
20
32
Sacrifice Flies
39
Pitching
129
Team Games Played
130
51
Quality Starts
39
62
Wins
63
67
Losses
67
34
Saves
43
68
Holds
83
1117
Hits
1036
538
Earned runs
509
138
Home Runs
133
427
Walks
474
1031
Strikeouts
1127
8.1
Strikeouts Per 9 Innings
8.8
145.7
Pitches Per Start
148.9
1.35
Walks Plus Hits Per Inning Pitched
1.30
4.22
Earned Run Average
3.96
67
Losses
67
1146.2
Innings pitched
1157.1
.481
Win Percentage
.485
52
Save Opportunities
58
.254
Opponent Batting Average
.239
.322
Opponent's On-base pct.
.316
.410
Opponent's Slugging pct.
.375
.732
Opponent's OPB Pct + SLG Pct
.690
4397
At Bats
4337
224
Doubles
173
23
Triples
9
37
Batters Hit
31
69
Stolen Bases
123
129
Games Played
130
1
Complete Games
1
2
Shutouts
8
40
Wild Pitches
41
586
Runs Batted In
537
2
Balks
5
1146.2
Innings pitched
1157.1
8.1
Strikeouts Per 9 Innings
8.8
30
Caught Stealing
39
129
Games Started
130
0.0
Wins Above Replacement
0.0
1
Is Qualified
1
613
Runs
565
538
Earned Runs
509
1801
Total Bases
1626
Fielding
129
Team Games Played
130
1147
Full Innings
1157
4629
Total Chances
4662
3440
Putouts
3472
1107
Assists
1111
82
Errors
79
185
Double Plays
204
0.982
Fielding Percentage
0.983
35.7
Range Factor
35.6
0.0
Zone Rating
0.0
129
Games Played
130
0
Games Started
0
0.0
Defensive Wins Above Replacement
0.0
1
Qualified
1