

Red Sox vs Pirates Live Score (14 Aug, 2026)
Game Information
Stage
Standard
Season
2026
First Pitch
Fri, Aug 14, 6:40 pm
Venue
PNC Park
Location
Pittsburgh, Pennsylvania
Attendance
32,036
Home Runs
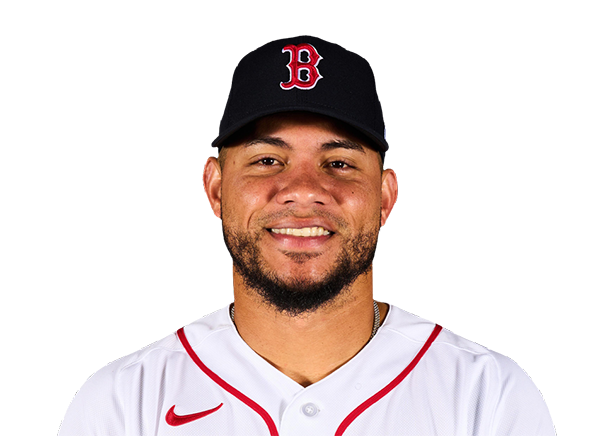
Willson Contreras
24 HR
.280 AVG
72 RBI
Brandon Lowe
25 HR
.250 AVG
74 RBI

Batting Average
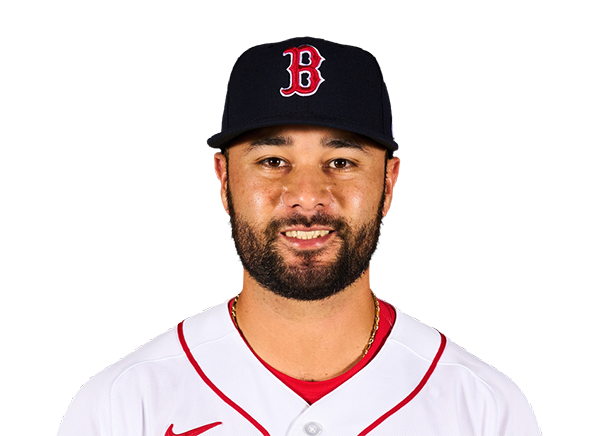
Ceddanne Rafaela
.288 AVG
.326 OBP
.467 SLG

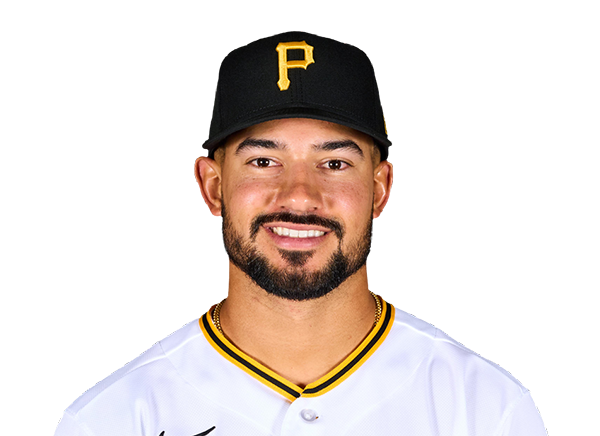
Nick Gonzales
.309 AVG
.362 OBP
.401 SLG
Runs Batted In
Willson Contreras
72 RBI
24 HR
.280 AVG
Brandon Lowe
74 RBI
25 HR
.250 AVG
Earned Run Average
Sonny Gray
2.79 ERA
14 W
110 K

Paul Skenes
3.88 ERA
9 W
166 K

Wins
Sonny Gray
14 W
2.79 ERA
110 K
Braxton Ashcraft
12 W
3.88 ERA
155 K

Strikeouts
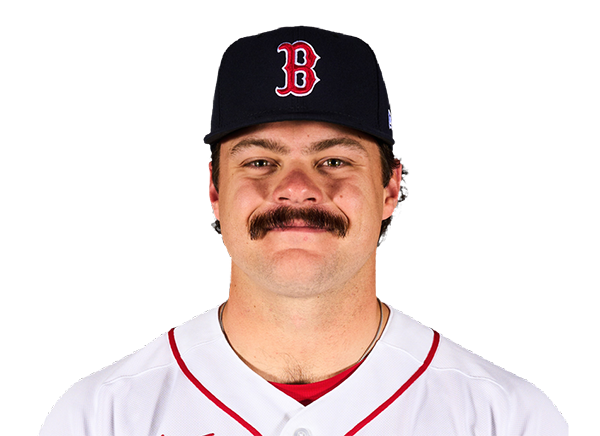
Payton Tolle
128 K
8 W
2.97 ERA
Paul Skenes
166 K
9 W
3.88 ERA
Injury Report
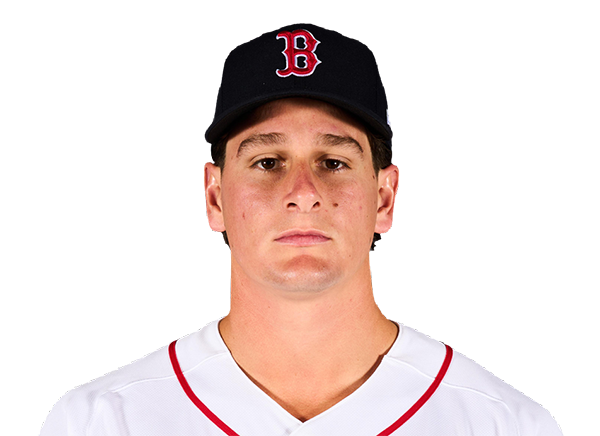
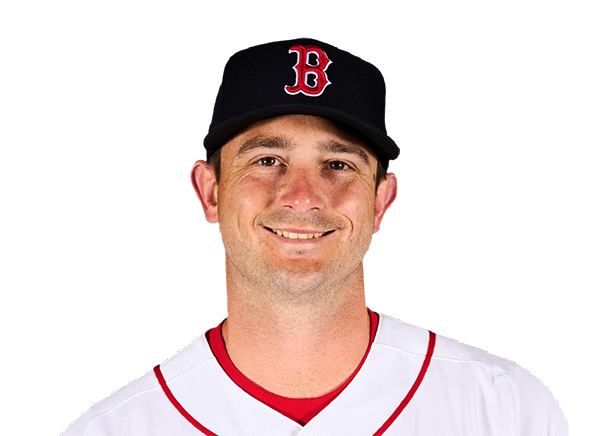
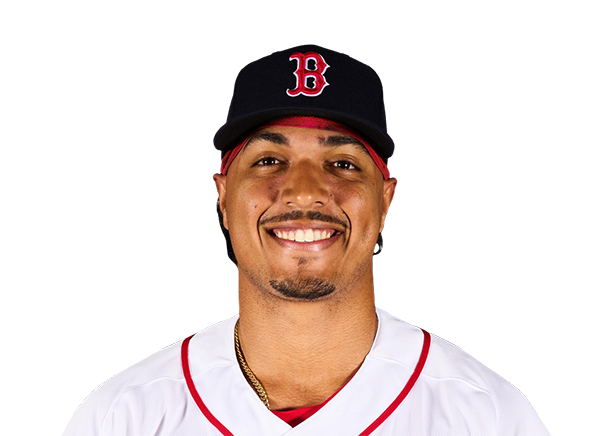

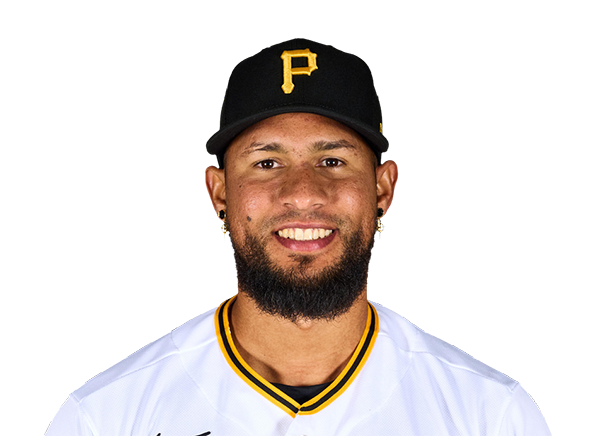

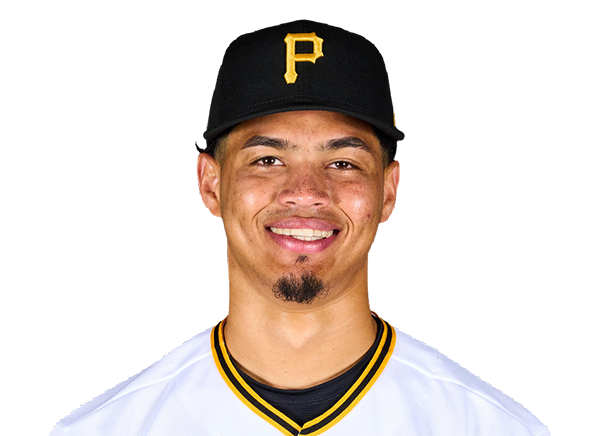
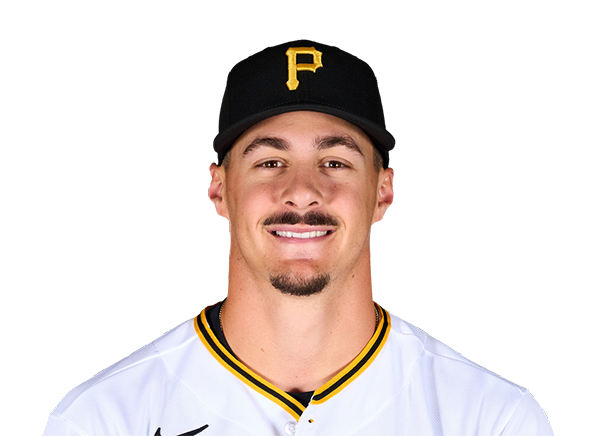
Team Stats
 BOS
PIT


Array
Runs
Array
9
Hits
9
1
Errors
1
—
Home Runs
—
—
Walks
—
—
Strikeouts
—
Standings
American League
| Team | W | L | PCT | GB | DIFF | STRK |
|---|---|---|---|---|---|---|
1 Rays | 76 | 53 | .589 | - | +42 | L3 |
2 White Sox | 67 | 62 | .519 | 9 | +42 | L1 |
3 Astros | 65 | 65 | .500 | 11.5 | -43 | L1 |
4 Yankees | 73 | 56 | .566 | 3 | +95 | L1 |
| 5Red Sox | 70 | 59 | .543 | 6 | +98 | W2 |
6 Rangers | 64 | 66 | .492 | 12.5 | -48 | L1 |
7 Guardians | 64 | 66 | .492 | 12.5 | -14 | W3 |
8 Blue Jays | 64 | 67 | .489 | 13 | -50 | W1 |
9 Twins | 63 | 67 | .485 | 13.5 | -47 | L2 |
10 Orioles | 63 | 67 | .485 | 13.5 | -33 | W2 |
11 Mariners | 62 | 68 | .477 | 14.5 | -44 | W2 |
12 Tigers | 61 | 68 | .473 | 15 | +77 | L4 |
13 Royals | 57 | 74 | .435 | 20 | -95 | W7 |
14 Angels | 52 | 78 | .400 | 24.5 | -68 | W1 |
15 Athletics | 50 | 80 | .385 | 26.5 | -188 | W1 |
National League
| Team | W | L | PCT | GB | DIFF | STRK |
|---|---|---|---|---|---|---|
1 Brewers | 81 | 49 | .623 | - | +163 | W3 |
2 Dodgers | 79 | 51 | .608 | 2 | +147 | W5 |
3 Braves | 75 | 55 | .577 | 6 | +108 | L2 |
4 Cubs | 74 | 56 | .569 | 7 | +98 | L3 |
5 Phillies | 72 | 58 | .554 | 9 | +25 | W8 |
6 Padres | 70 | 60 | .538 | 11 | +9 | W2 |
7 Diamondbacks | 68 | 62 | .523 | 13 | +7 | L1 |
8 Marlins | 66 | 64 | .508 | 15 | +17 | W2 |
9 Cardinals | 66 | 65 | .504 | 15.5 | 0 | L2 |
| 10Pirates | 63 | 68 | .481 | 18.5 | +29 | L2 |
11 Reds | 62 | 68 | .477 | 19 | -92 | W1 |
12 Nationals | 61 | 70 | .466 | 20.5 | +14 | L3 |
13 Mets | 59 | 71 | .454 | 22 | -39 | W1 |
14 Giants | 52 | 77 | .403 | 28.5 | -79 | L3 |
15 Rockies | 50 | 79 | .388 | 30.5 | -131 | L5 |
BOS
VS
PIT
Pitchers

Jake Bennett
Catchers

Adley Rutschman
Infielders

Nick Sogard
Willson Contreras
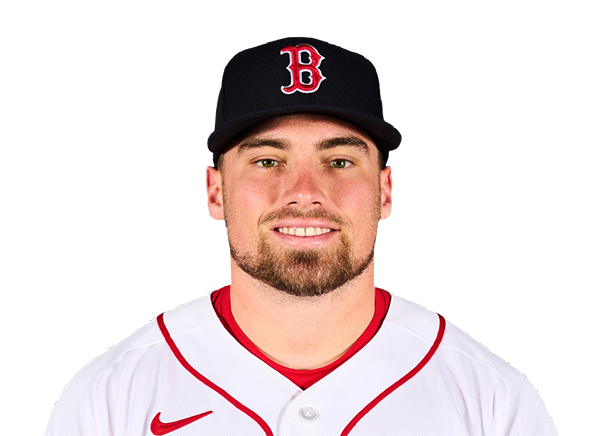
Caleb Durbin

Andruw Monasterio
Outfielders

Wilyer Abreu
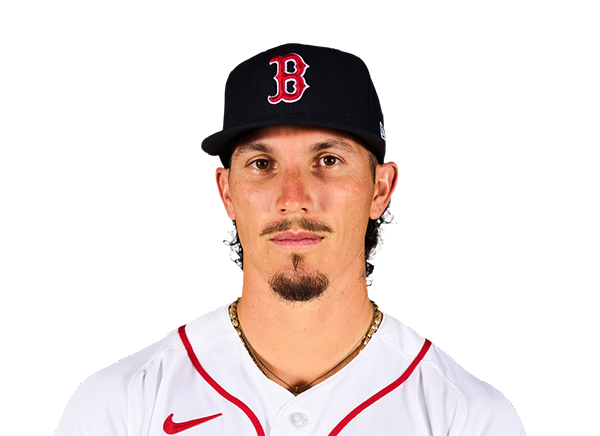
Jarren Duran

Eli White
Designated Hitters
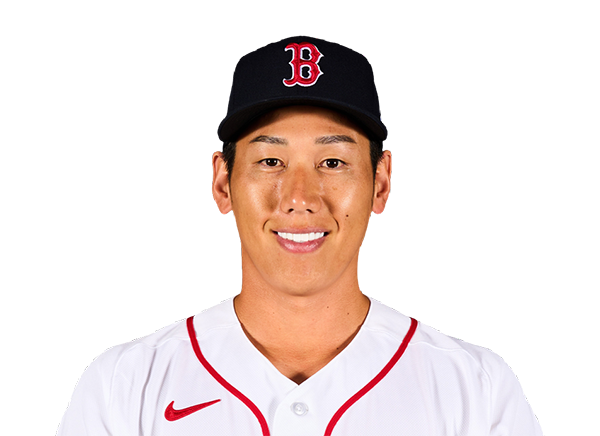
Masataka Yoshida
Pitchers

Bubba Chandler
Catchers
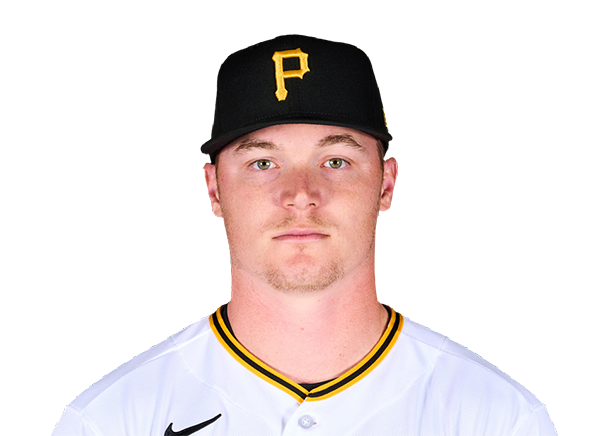
Henry Davis
Infielders
Nick Gonzales
Brandon Lowe

Rafael Flores Jr.

Jared Triolo
Outfielders

Bryan Reynolds
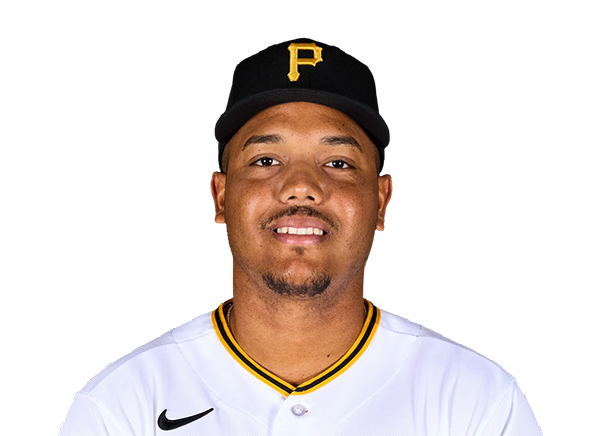
Esmerlyn Valdez

Jake Mangum
Designated Hitters

Ronny Simon
Red Sox
VS
Pirates
Batting
122
Team Games Played
124
4079
At Bats
4285
1012
Hits
1099
518
Runs Batted In
596
122
Home Runs
151
93
Stolen Bases
106
.248
Batting Average
.256
542
Runs
625
218
Doubles
192
18
Triples
13
1632
Total Bases
1770
386
Walks
445
997
Strikeouts
1167
.321
On Base Percentage
.334
.400
Slugging Percentage
.413
.721
OBP Pct + SLG Pct
.747
122
Games Played
124
122
Games Started
124
71
Hit By Pitch
65
0.0
Wins Above Replacement
0.0
0.0
Offensive Wins Above Replacement
0.0
34
Caught Stealing
20
1
Is Qualified
1
536.3
Runs Created
603.6
4.5
Runs Created Per 27 Outs
4.9
.084
Walks Per Plate Appearance
.092
0.39
Walk To Strikeout Ratio
0.38
.152
Isolated Power
.157
.261
Secondary Average
.281
3.82
Pitches Per Plate Appearance
3.91
358
Extra Base Hits
356
4609
Plate Appearances
4834
33.4
At Bats Per Home Run
28.4
28
Sacrifice Hit
7
43
Sacrifice Flies
29
Pitching
122
Team Games Played
124
51
Quality Starts
38
65
Wins
60
57
Losses
64
34
Saves
24
75
Holds
51
980
Hits
1012
423
Earned runs
531
119
Home Runs
129
343
Walks
452
1042
Strikeouts
1147
8.6
Strikeouts Per 9 Innings
9.3
139.4
Pitches Per Start
150.8
1.22
Walks Plus Hits Per Inning Pitched
1.32
3.51
Earned Run Average
4.32
57
Losses
64
1084.1
Innings pitched
1105.2
.533
Win Percentage
.484
45
Save Opportunities
44
.240
Opponent Batting Average
.241
.304
Opponent's On-base pct.
.322
.377
Opponent's Slugging pct.
.393
.681
Opponent's OPB Pct + SLG Pct
.715
4091
At Bats
4203
190
Doubles
226
8
Triples
13
48
Batters Hit
68
84
Stolen Bases
78
122
Games Played
124
0
Complete Games
1
12
Shutouts
7
27
Wild Pitches
43
443
Runs Batted In
559
3
Balks
4
1084.1
Innings pitched
1105.2
8.6
Strikeouts Per 9 Innings
9.3
15
Caught Stealing
26
122
Games Started
124
0.0
Wins Above Replacement
0.0
1
Is Qualified
1
460
Runs
596
423
Earned Runs
531
1543
Total Bases
1651
Fielding
122
Team Games Played
124
1084
Full Innings
1106
4372
Total Chances
4362
3253
Putouts
3317
1059
Assists
970
60
Errors
75
218
Double Plays
192
0.986
Fielding Percentage
0.983
35.8
Range Factor
34.9
0.0
Zone Rating
0.0
122
Games Played
124
0
Games Started
0
0.0
Defensive Wins Above Replacement
0.0
1
Qualified
1