

76ers vs Pelicans Live Score (29 Jan, 2027)
Game Information
League
NBA
Season
1
Date
January 28, 2027
Tipoff
8:00 PM EST
Status
Scheduled
Team Stats
 PHI
Game Comparison
NO

-Points-
-Rebounds-
-Assists-
43Field Goal %49
-3-Point %-
-Free Throw %-
Game Leaders
PHINO
 —#
Points
—
—#
—#Rebounds
—
—#
—#Assists
—
—#
Injury Report
H2H / Season Series
Last 5 Games







NBA Standings
Eastern Conference — Atlantic
| Team | W | L | PCT | GB | STRK |
|---|---|---|---|---|---|
| Philadelphia | 4 | 1 | .800 | - | W1 |
 Boston | 3 | 1 | .750 | 0.5 | W3 |
 Toronto | 3 | 1 | .750 | 0.5 | W1 |
 New York | 2 | 3 | .400 | 2 | W2 |
 Brooklyn | 0 | 4 | .000 | 3.5 | L4 |
Western Conference — Southwest
| Team | W | L | PCT | GB | STRK |
|---|---|---|---|---|---|
 Houston | 5 | 0 | 1.000 | - | W5 |
 Memphis | 5 | 0 | 1.000 | - | W5 |
 San Antonio | 3 | 2 | .600 | 2 | W3 |
 Dallas | 3 | 2 | .600 | 2 | W2 |
| New Orleans | 1 | 4 | .200 | 4 | W1 |
Rosters
76ers
1st in Atlantic Division
VS
Pelicans
10th in Western Conference Division
Guard

Tyrese Maxey
#7

Jaylen Brown
#77
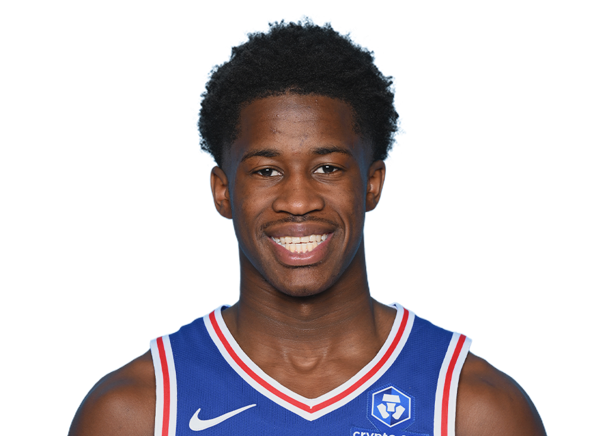
VJ Edgecombe
#5
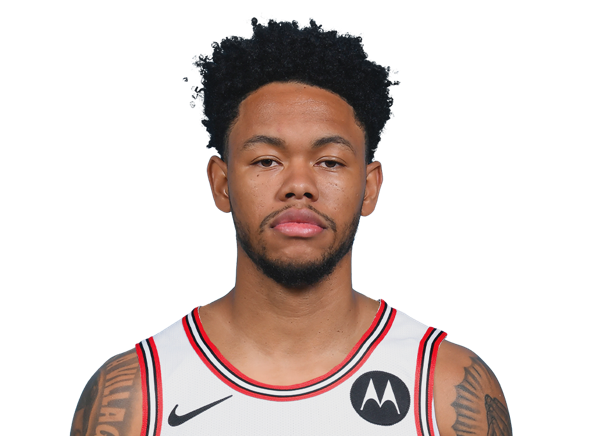
Anfernee Simons
#1

Kentavious Caldwell-Pope
#00

Labaron Philon Jr.
#12

Rayan Rupert
#8

Caleb Love
Center
#21
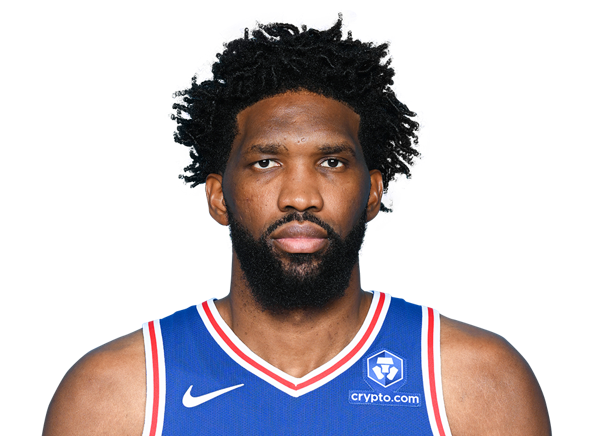
Joel Embiid
#30

Adem Bona
#55

Ariel Hukporti
Forward
#23
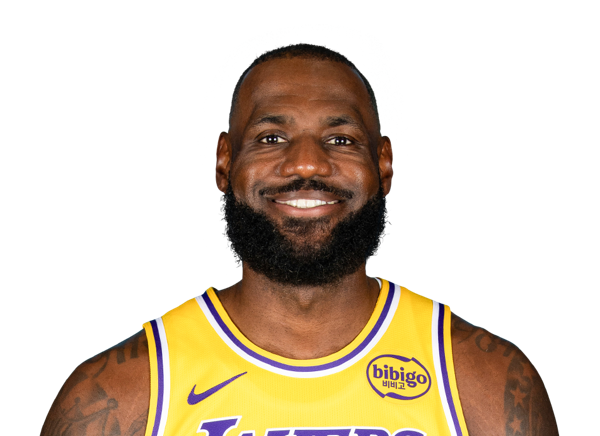
LeBron James
#45

Dean Wade
#33
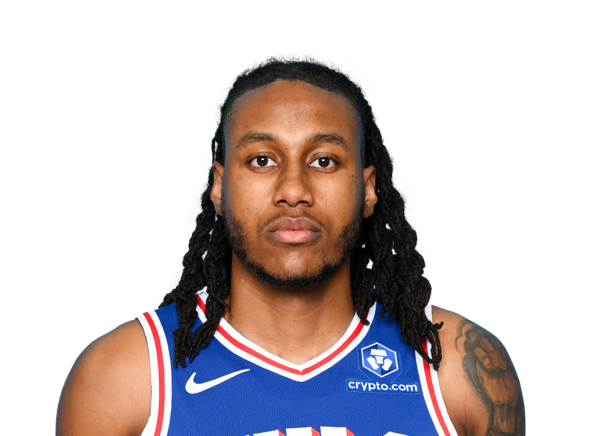
Jabari Walker
#11
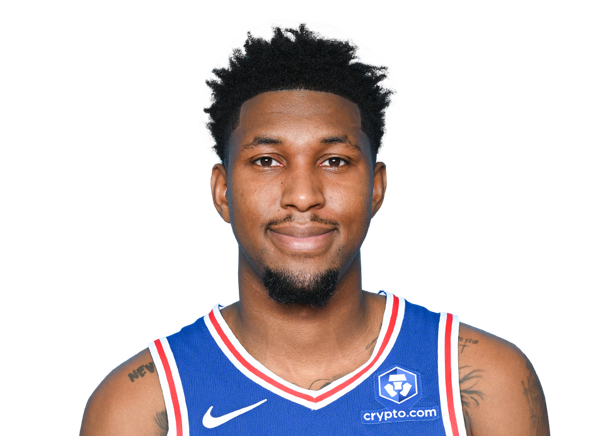
Justin Edwards
#25

Dominick Barlow
Forward
#1

Zion Williamson
#41
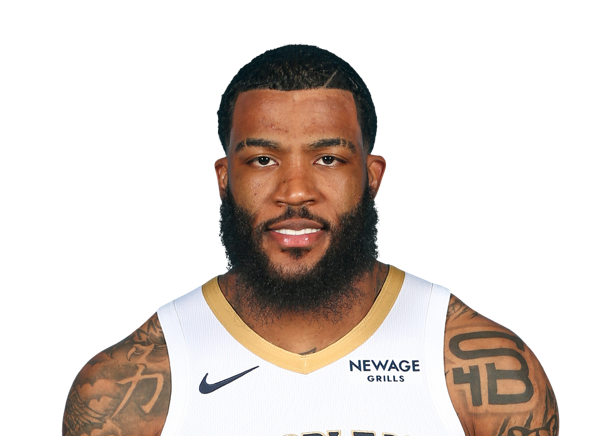
Saddiq Bey
#25

Trey Murphy III
#17

Karlo Matkovic
#2

Herbert Jones
#9
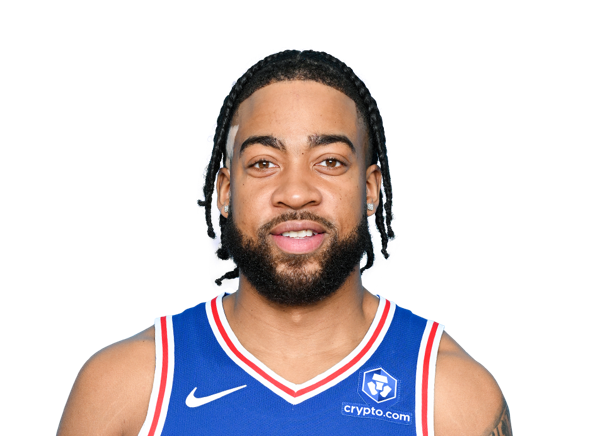
Trendon Watford
#13

Julian Reese
Guard
#5

Dejounte Murray

Jeremiah Fears
#24
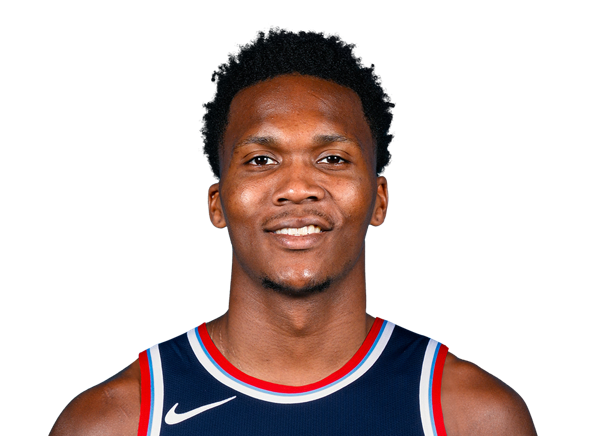
Bennedict Mathurin
#3

Jordan Poole
#11

Bryce McGowens
#14
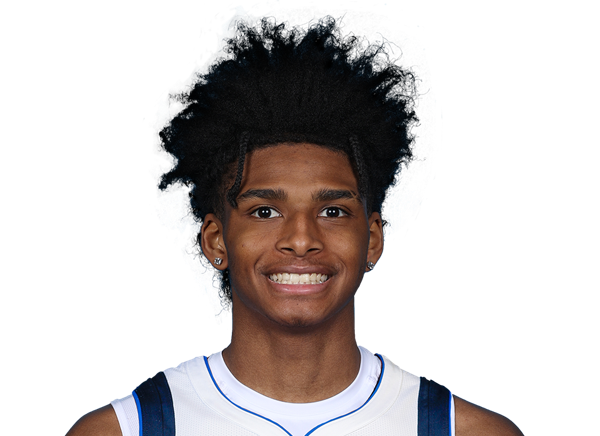
AJ Johnson
Center
#22
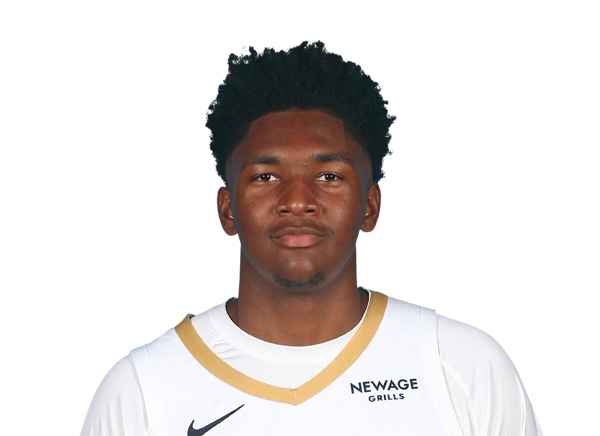
Derik Queen
#21
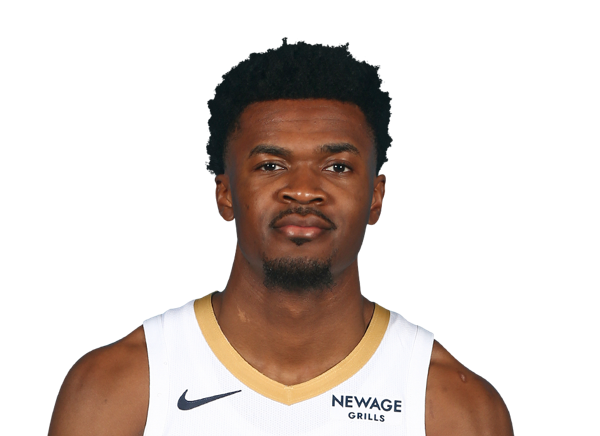
Yves Missi
#6

DeAndre Jordan
Team Statistics
76ers
1st in Atlantic Division
VS
Pelicans
10th in Western Conference Division
General
42.3
Rebounds Per Game
44.9
2.1
Assist To Turnover Ratio
1.5
21.9
Fouls Per Game
23.0
9
Games Played
8
0
Games Started
0
0
Minutes
0
0.0
Minutes Per Game
0.0
381
Rebounds
359
381
Rebounds
359
Offensive
76.7
Free Throw Percentage
82.4
34.4
3-Point Field Goal Percentage
31.7
39.9
Average Field Goals Made
43.1
88.2
Average Field Goals Attempted
88.5
11.4
Average 3-Point Field Goals Made
9.0
33.2
Average 3-Point Field Goals Attempted
28.4
19.8
Average Free Throws Made
26.4
25.8
Average Free Throws Attempted
32.0
111.0
Points Per Game
121.6
9.4
Offensive Rebounds Per Game
10.9
26.1
Assists Per Game
25.4
12.3
Turnovers Per Game
16.8
51.7
2-Point Field Goal Percentage
56.8
1.258
Scoring Efficiency
1.374
0.52
Shooting Efficiency
0.54
45.2
Field Goal Percentage
48.7
256.0
2-Point Field Goals Made
273.0
495.0
2-Point Field Goals Attempted
481.0
999
Points
973
85
Offensive Rebounds
87
235
Assists
203
111
Turnovers
134
359
Field Goals Made
345
794
Field Goals Attempted
708
178
Free Throws Made
211
232
Free Throws Attempted
256
103
3-Point Field Goals Made
72
299
3-Point Field Goals Attempted
227
34.4
3-Point Field Goal Percentage
31.7
28.4
2-Point Field Goals Made per Game
34.1
55.0
2-Point Field Goals Attempted per Game
60.1
Defensive
32.9
Defensive Rebounds Per Game
34.0
4.7
Blocks Per Game
4.8
8.9
Steals Per Game
12.4
296
Defensive Rebounds
272
80
Steals
99
42
Blocks
38