

Hawks vs Wizards Live Score (5 Nov, 2026)
Game Information
League
NBA
Season
2027
Date
November 4, 2026
Tipoff
7:00 PM EST
Status
Scheduled
ATL Record
4-4
WSH Record
4-3
Venue
Capital One Arena
Location
Washington, DC
Arena Type
Indoor
Broadcast
MNMT
Team Stats
 ATL
Game Comparison
WSH

-Points-
-Rebounds-
-Assists-
45Field Goal %48
-3-Point %-
-Free Throw %-
Game Leaders
ATLWSH
 —#
Points
—
—#
—#Rebounds
—
—#
—#Assists
—
—#
Injury Report
Washington Wizards
H2H / Season Series
Last 5 Games





NBA Standings
Eastern Conference — Southeast
| Team | W | L | PCT | GB | STRK |
|---|---|---|---|---|---|
| Washington | 4 | 3 | .571 | - | W2 |
| Atlanta | 4 | 4 | .500 | 0.5 | W1 |
 Charlotte | 3 | 5 | .375 | 1.5 | L4 |
 Miami | 2 | 5 | .286 | 2 | L1 |
 Orlando | 2 | 5 | .286 | 2 | L2 |
Rosters
Hawks
7th in Eastern Conference Division
VS
Wizards
4th in Eastern Conference Division
Guard
#7

Nickeil Alexander-Walker
#22

Devin Carter
#5

Dyson Daniels
#00

RayJ Dennis
#5

Luguentz Dort

Kingston Flemings

Keshon Gilbert
#8

Buddy Hield
#3

CJ McCollum
#9

Ryan Nembhard
#2

Keaton Wallace
#21
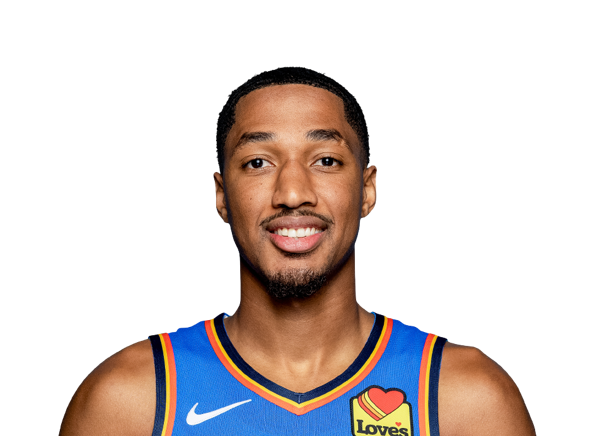
Aaron Wiggins
Forward

Zuby Ejiofor
#18

Mouhamed Gueye
#1

Jalen Johnson
#24

Corey Kispert
#14

Asa Newell
#17

Onyeka Okongwu
#22
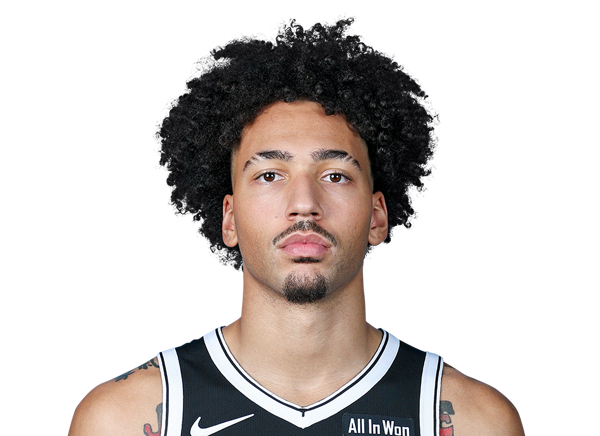
Jalen Wilson
Center
#35

Christian Koloko
#31

Jock Landale

Henri Veesaar
Forward
#23

Anthony Davis
#18
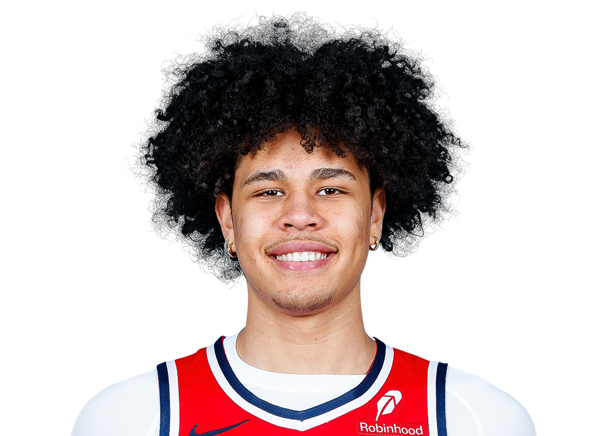
Kyshawn George
#22

Khris Middleton
#4

AJ Dybantsa
#9
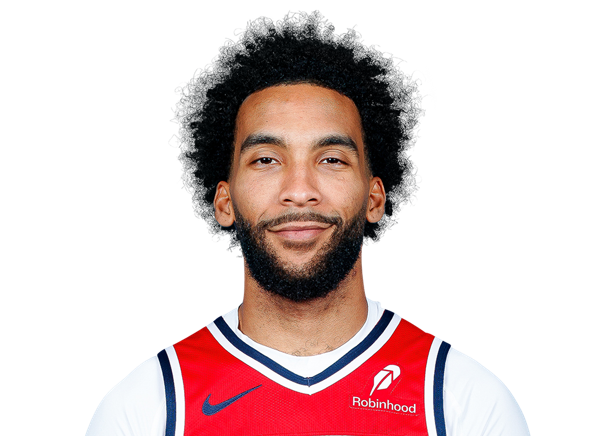
Justin Champagnie
#34

Felix Okpara
#16

Anthony Gill
#00

Tristan Vukcevic
Guard
#3

Trae Young
#12
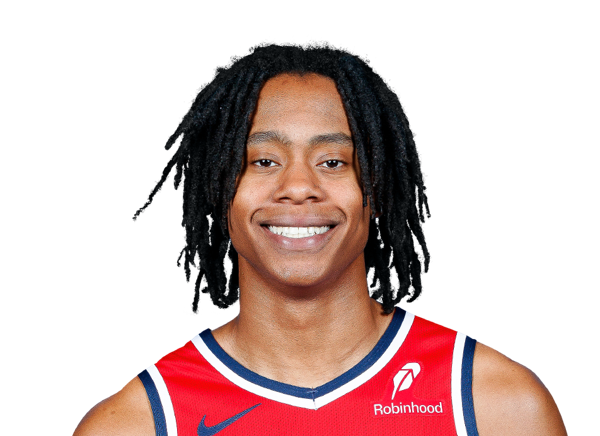
Tre Johnson

Bilal Coulibaly
#7

Bub Carrington
#27
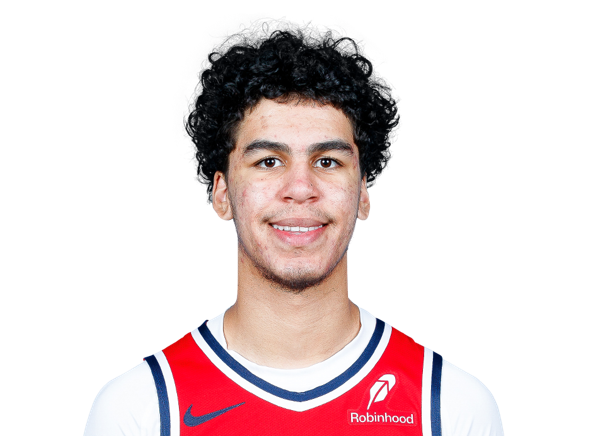
Will Riley
#26
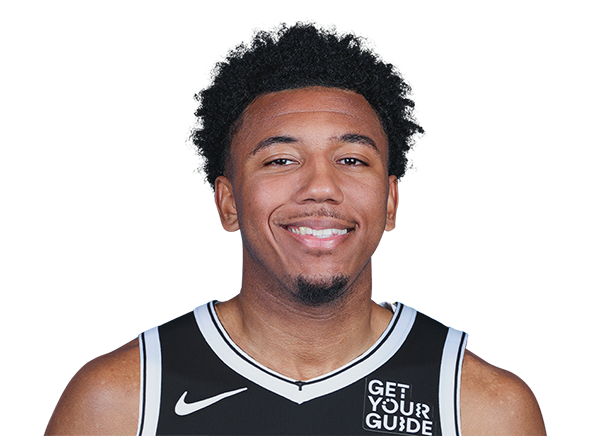
Reece Beekman
#1

Tre Mann
#5

Jamir Watkins
Center
#20

Alex Sarr
#8
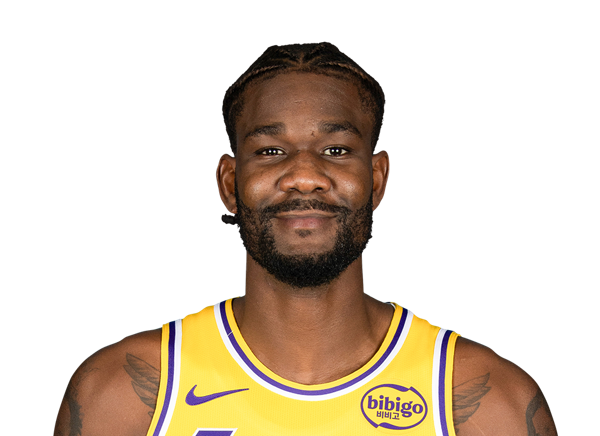
Deandre Ayton
Team Statistics
Hawks
7th in Eastern Conference Division
VS
Wizards
4th in Eastern Conference Division
General
43.1
Rebounds Per Game
41.0
2.1
Assist To Turnover Ratio
1.8
23.5
Fouls Per Game
21.1
8
Games Played
7
0
Games Started
0
0
Minutes
0
0.0
Minutes Per Game
0.0
345
Rebounds
287
345
Rebounds
287
Offensive
74.7
Free Throw Percentage
82.5
34.6
3-Point Field Goal Percentage
30.2
42.5
Average Field Goals Made
39.0
95.5
Average Field Goals Attempted
82.0
15.0
Average 3-Point Field Goals Made
9.1
43.4
Average 3-Point Field Goals Attempted
30.3
15.1
Average Free Throws Made
22.3
20.3
Average Free Throws Attempted
27.0
115.1
Points Per Game
109.4
13.5
Offensive Rebounds Per Game
8.3
30.6
Assists Per Game
24.7
14.5
Turnovers Per Game
13.7
52.8
2-Point Field Goal Percentage
57.7
1.205
Scoring Efficiency
1.334
0.52
Shooting Efficiency
0.53
44.5
Field Goal Percentage
47.6
220.0
2-Point Field Goals Made
209.0
417.0
2-Point Field Goals Attempted
362.0
921
Points
766
108
Offensive Rebounds
58
245
Assists
173
116
Turnovers
96
340
Field Goals Made
273
764
Field Goals Attempted
574
121
Free Throws Made
156
162
Free Throws Attempted
189
120
3-Point Field Goals Made
64
347
3-Point Field Goals Attempted
212
34.6
3-Point Field Goal Percentage
30.2
27.5
2-Point Field Goals Made per Game
29.9
52.1
2-Point Field Goals Attempted per Game
51.7
Defensive
29.6
Defensive Rebounds Per Game
32.7
3.6
Blocks Per Game
5.3
9.8
Steals Per Game
7.6
237
Defensive Rebounds
229
78
Steals
53
29
Blocks
37