

Heat vs Raptors Live Score (16 Jan, 2027)
Game Information
League
NBA
Season
1
Date
January 15, 2027
Tipoff
7:30 PM EST
Status
Scheduled
Team Stats
 MIA
Game Comparison
TOR

-Points-
-Rebounds-
-Assists-
-Field Goal %-
-3-Point %-
-Free Throw %-
Injury Report

H2H / Season Series
Last 5 Games




NBA Standings
Eastern Conference — Southeast
| Team | W | L | PCT | GB | STRK |
|---|---|---|---|---|---|
 Atlanta | 4 | 1 | .800 | - | W4 |
 Orlando | 3 | 1 | .750 | 0.5 | W2 |
| Miami | 3 | 2 | .600 | 1 | L1 |
 Washington | 2 | 2 | .500 | 1.5 | L2 |
 Charlotte | 1 | 3 | .250 | 2.5 | L2 |
Eastern Conference — Atlantic
| Team | W | L | PCT | GB | STRK |
|---|---|---|---|---|---|
 Boston | 4 | 0 | 1.000 | - | W4 |
 Brooklyn | 3 | 1 | .750 | 1 | L1 |
| Toronto | 2 | 3 | .400 | 2.5 | L2 |
 Philadelphia | 1 | 3 | .250 | 3 | L3 |
 New York | 1 | 4 | .200 | 3.5 | W1 |
Rosters
Heat
10th in Eastern Conference Division
VS
Raptors
3rd in Atlantic Division
Forward
#7
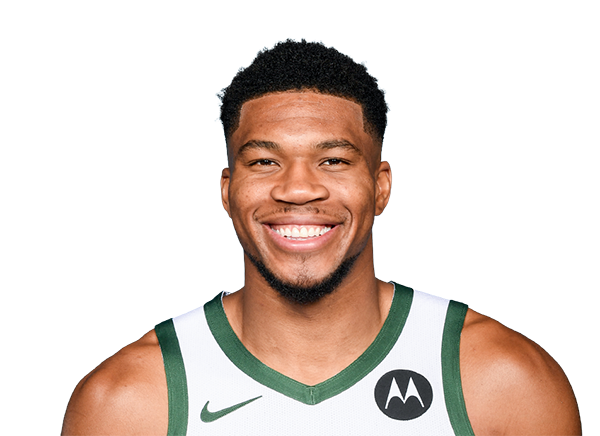
Giannis Antetokounmpo
#22

Andrew Wiggins
#95

Bobby Portis
#5

Nikola Jovic

Simone Fontecchio
#15
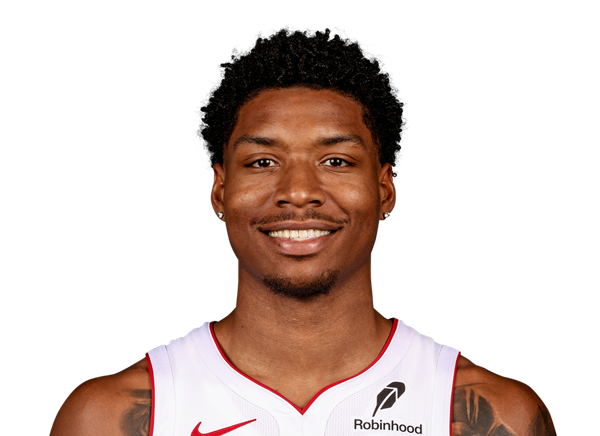
Myron Gardner
Center
#13

Bam Adebayo
#8

Nick Richards
Guard
#2

Davion Mitchell
#11
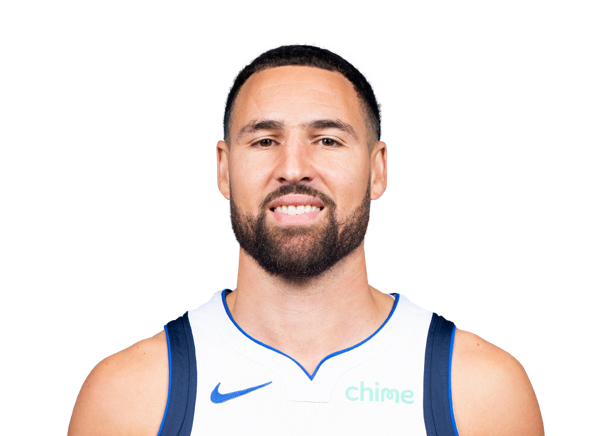
Klay Thompson
#9

Pelle Larsson
#10

Tim Hardaway Jr.
#12

Dru Smith
#4

Ryan Conwell
Forward
#4

Scottie Barnes
#9

RJ Barrett
#30

Collin Murray-Boyles
#77

Jamison Battle
#22

Allen Graves
#32
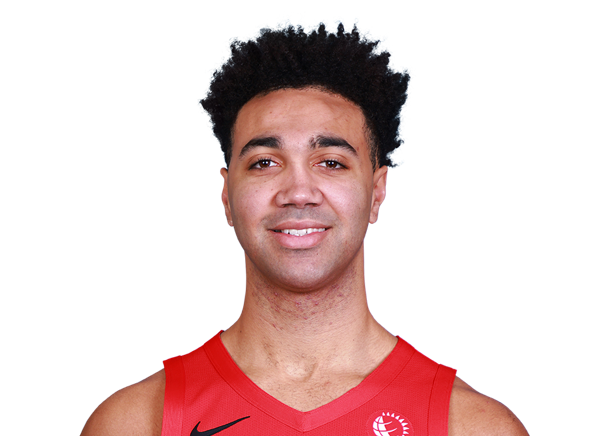
Trayce Jackson-Davis
#12

Kyle Anderson
#2
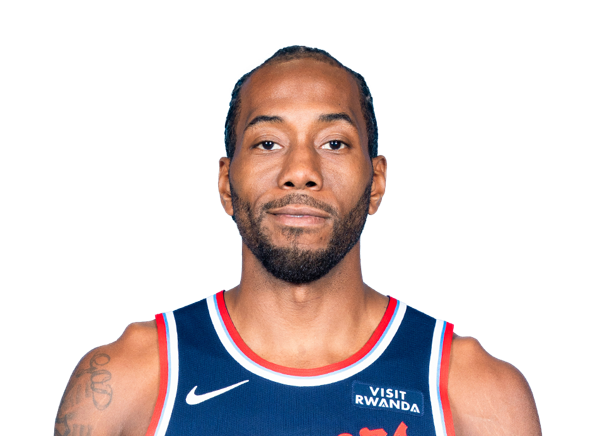
Kawhi Leonard
Guard
#5

Immanuel Quickley
#14

Ja'Kobe Walter
#23

Jamal Shead
#55

Alijah Martin
#8

Jaden Bradley
Center
#19

Jakob Poeltl

Nate Bittle
Team Statistics
Heat
10th in Eastern Conference Division
VS
Raptors
3rd in Atlantic Division
General
42.3
Rebounds Per Game
44.1
1.9
Assist To Turnover Ratio
2.1
21.1
Fouls Per Game
27.9
7
Games Played
7
0
Games Started
0
0
Minutes
0
0.0
Minutes Per Game
0.0
296
Rebounds
309
296
Rebounds
309
Offensive
73.0
Free Throw Percentage
74.4
34.8
3-Point Field Goal Percentage
31.5
42.7
Average Field Goals Made
43.0
89.3
Average Field Goals Attempted
93.9
13.4
Average 3-Point Field Goals Made
11.1
38.6
Average 3-Point Field Goals Attempted
35.4
19.3
Average Free Throws Made
22.0
26.4
Average Free Throws Attempted
29.6
118.1
Points Per Game
119.1
10.6
Offensive Rebounds Per Game
15.3
28.7
Assists Per Game
28.7
15.1
Turnovers Per Game
13.6
57.7
2-Point Field Goal Percentage
54.5
1.323
Scoring Efficiency
1.269
0.55
Shooting Efficiency
0.52
47.8
Field Goal Percentage
45.8
205.0
2-Point Field Goals Made
223.0
355.0
2-Point Field Goals Attempted
409.0
827
Points
834
74
Offensive Rebounds
107
201
Assists
201
106
Turnovers
95
299
Field Goals Made
301
625
Field Goals Attempted
657
135
Free Throws Made
154
185
Free Throws Attempted
207
94
3-Point Field Goals Made
78
270
3-Point Field Goals Attempted
248
34.8
3-Point Field Goal Percentage
31.5
29.3
2-Point Field Goals Made per Game
31.9
50.7
2-Point Field Goals Attempted per Game
58.4
Defensive
31.7
Defensive Rebounds Per Game
28.9
5.0
Blocks Per Game
4.3
8.1
Steals Per Game
11.7
222
Defensive Rebounds
202
57
Steals
82
35
Blocks
30