

Hornets vs Celtics Live Score (24 Jan, 2027)
Game Information
League
NBA
Season
1
Date
January 23, 2027
Tipoff
7:00 PM EST
Status
Scheduled
Team Stats
 CHA
Game Comparison
BOS

-Points-
-Rebounds-
-Assists-
41Field Goal %46
-3-Point %-
-Free Throw %-
Game Leaders
CHABOS
 —#
Points
—
—#
—#Rebounds
—
—#
—#Assists
—
—#
Injury Report
Boston Celtics
H2H / Season Series
Last 5 Games


NBA Standings
Eastern Conference — Southeast
| Team | W | L | PCT | GB | STRK |
|---|---|---|---|---|---|
 Atlanta | 2 | 1 | .667 | - | L1 |
| Charlotte | 2 | 1 | .667 | - | W1 |
 Washington | 2 | 1 | .667 | - | W1 |
 Orlando | 0 | 2 | .000 | 1.5 | L2 |
 Miami | 0 | 3 | .000 | 2 | L3 |
Eastern Conference — Atlantic
| Team | W | L | PCT | GB | STRK |
|---|---|---|---|---|---|
 Philadelphia | 3 | 0 | 1.000 | - | W3 |
 Toronto | 2 | 0 | 1.000 | 0.5 | W2 |
| Boston | 1 | 1 | .500 | 1.5 | W1 |
 New York | 0 | 2 | .000 | 2.5 | L2 |
 Brooklyn | 0 | 2 | .000 | 2.5 | L2 |
Rosters
Hornets
9th in Eastern Conference Division
VS
Celtics
2nd in Atlantic Division
Forward
#24

Brandon Miller
#14

Moussa Diabate
#00

Royce O'Neale
#31

Tidjane Salaun
#22

Hannes Steinbach
#2
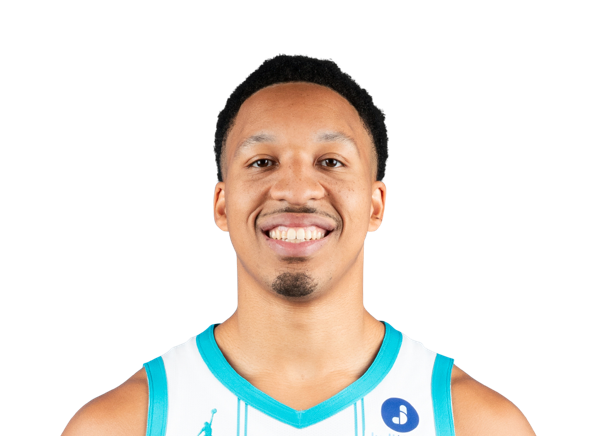
Grant Williams
Center

Naz Reid
#11

Ryan Kalkbrenner
#16

PJ Hall
Guard
#8

Grayson Allen
#17
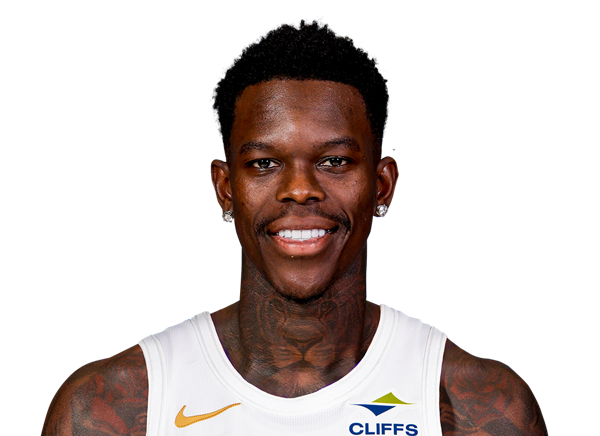
Dennis Schroder
#4

Sion James
#5
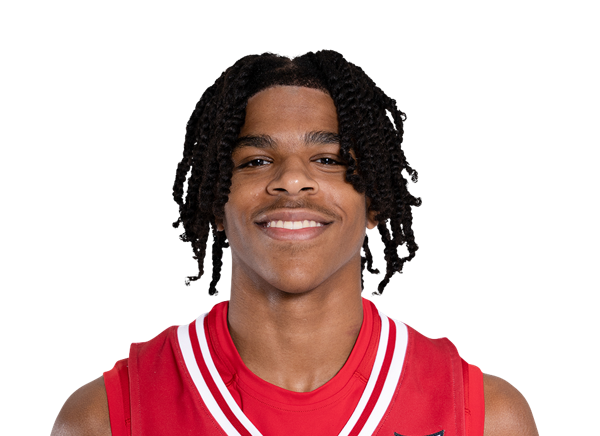
Christian Anderson
#3

Coby White
#33

Liam McNeeley
#7

Kon Knueppel
Forward

Jayson Tatum
#13
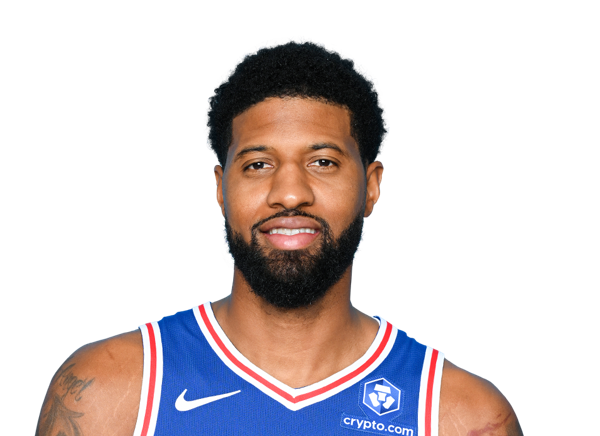
Paul George
#30

Sam Hauser
#12

Chris Cenac Jr.
#20
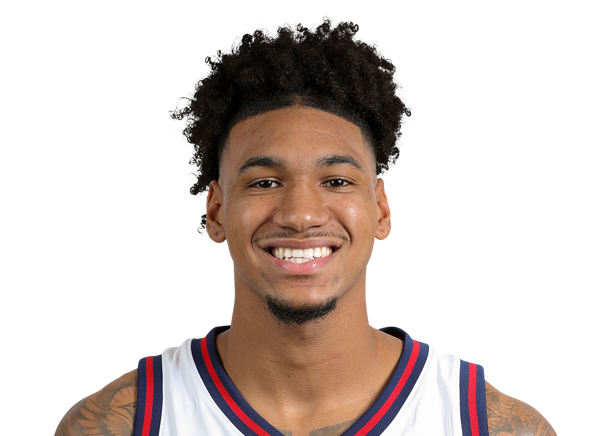
Dillon Mitchell
Guard
#11
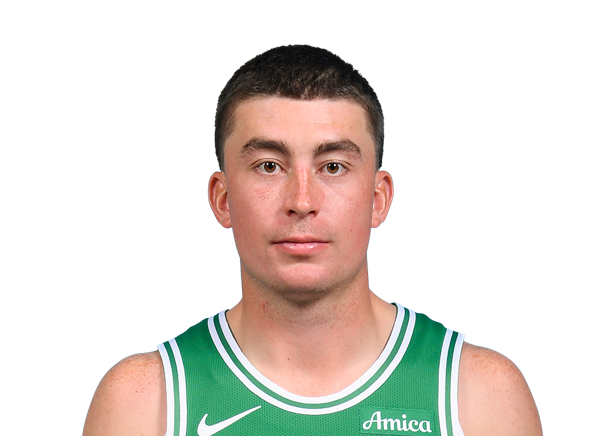
Payton Pritchard
#9
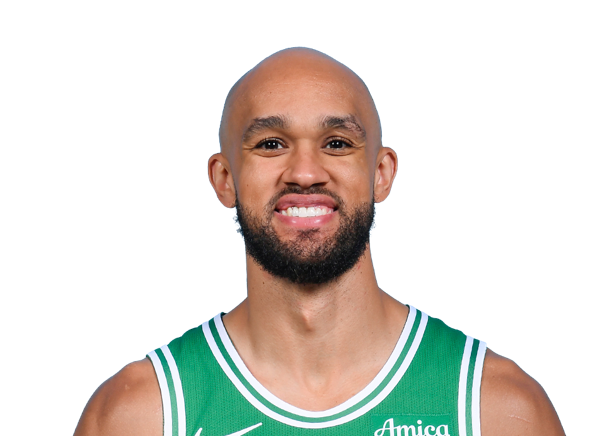
Derrick White
#55

Baylor Scheierman
#27

Jordan Walsh
#28
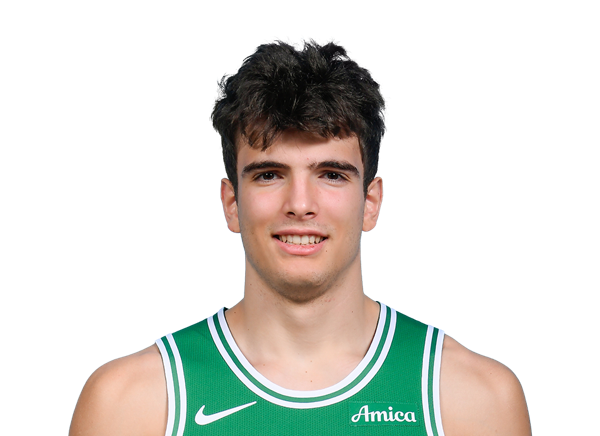
Hugo Gonzalez
#45
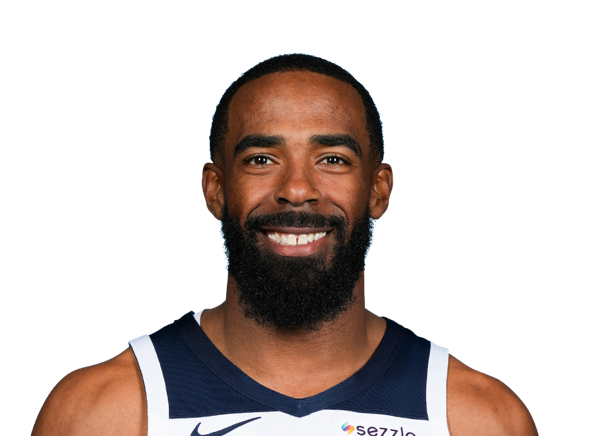
Mike Conley
#8

Ron Harper Jr.
#99
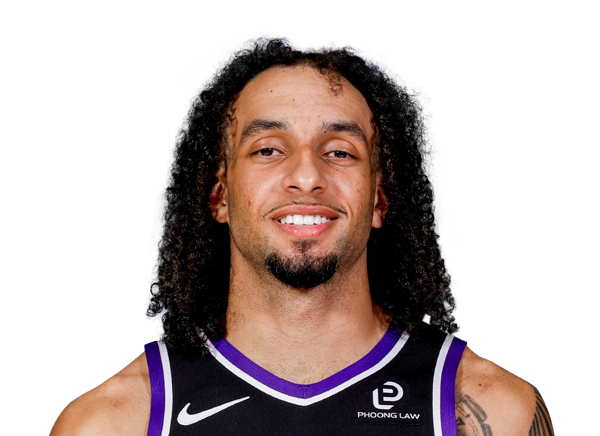
Devin Carter
Center
#88
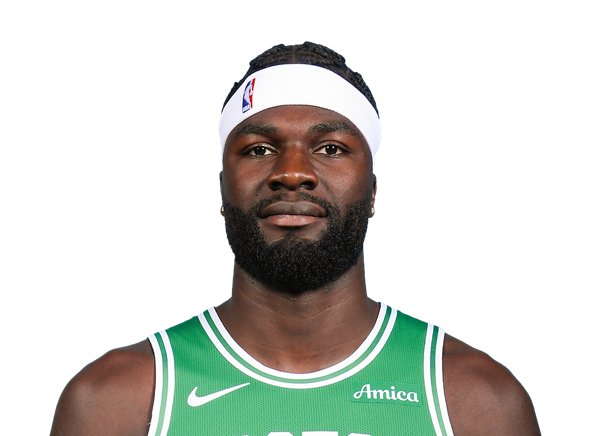
Neemias Queta
#52
Luka Garza
#4

Mitchell Robinson
Team Statistics
Hornets
9th in Eastern Conference Division
VS
Celtics
2nd in Atlantic Division
General
46.8
Rebounds Per Game
42.4
1.1
Assist To Turnover Ratio
1.8
20.5
Fouls Per Game
24.0
8
Games Played
7
0
Games Started
0
0
Minutes
0
0.0
Minutes Per Game
0.0
374
Rebounds
297
374
Rebounds
297
Offensive
81.5
Free Throw Percentage
78.4
29.6
3-Point Field Goal Percentage
34.5
35.3
Average Field Goals Made
39.9
87.1
Average Field Goals Attempted
87.1
13.1
Average 3-Point Field Goals Made
14.0
44.4
Average 3-Point Field Goals Attempted
40.6
13.8
Average Free Throws Made
21.3
16.9
Average Free Throws Attempted
27.1
97.4
Points Per Game
115.0
14.8
Offensive Rebounds Per Game
12.6
21.3
Assists Per Game
26.9
18.5
Turnovers Per Game
14.7
51.8
2-Point Field Goal Percentage
55.5
1.118
Scoring Efficiency
1.320
0.48
Shooting Efficiency
0.54
40.5
Field Goal Percentage
45.7
177.0
2-Point Field Goals Made
181.0
342.0
2-Point Field Goals Attempted
326.0
779
Points
805
118
Offensive Rebounds
88
170
Assists
188
148
Turnovers
103
282
Field Goals Made
279
697
Field Goals Attempted
610
110
Free Throws Made
149
135
Free Throws Attempted
190
105
3-Point Field Goals Made
98
355
3-Point Field Goals Attempted
284
29.6
3-Point Field Goal Percentage
34.5
22.1
2-Point Field Goals Made per Game
25.9
42.8
2-Point Field Goals Attempted per Game
46.6
Defensive
32.0
Defensive Rebounds Per Game
29.9
5.1
Blocks Per Game
3.7
7.3
Steals Per Game
8.7
256
Defensive Rebounds
209
58
Steals
61
41
Blocks
26