

Hornets vs Heat Live Score (27 Dec, 2026)
Game Information
League
NBA
Season
1
Date
December 27, 2026
Tipoff
6:00 PM EST
Status
Scheduled
Team Stats
 CHA
Game Comparison
MIA
-Points-
-Rebounds-
-Assists-
40Field Goal %47
-3-Point %-
-Free Throw %-
Game Leaders
CHAMIA
 —#
Points
—
—#
—#
Rebounds
—
—#
—#
Assists
—
—#
Injury Report
Miami Heat
H2H / Season Series
Last 5 Games









NBA Standings
Eastern Conference — Southeast
| Team | W | L | PCT | GB | STRK |
|---|---|---|---|---|---|
| Miami | 9 | 6 | .600 | - | W6 |
 Atlanta | 9 | 6 | .600 | - | W2 |
 Orlando | 6 | 8 | .429 | 2.5 | L1 |
 Washington | 5 | 11 | .313 | 4.5 | W1 |
| Charlotte | 4 | 10 | .286 | 4.5 | L3 |
Rosters
Hornets
12th in Eastern Conference Division
VS
Heat
6th in Eastern Conference Division
Forward
#24

Brandon Miller
#14

Moussa Diabate
#00

Royce O'Neale
#31

Tidjane Salaun
#2

Grant Williams
#22

Hannes Steinbach
Center

Naz Reid
#11

Ryan Kalkbrenner
#16

PJ Hall
Guard
#8

Grayson Allen
#17
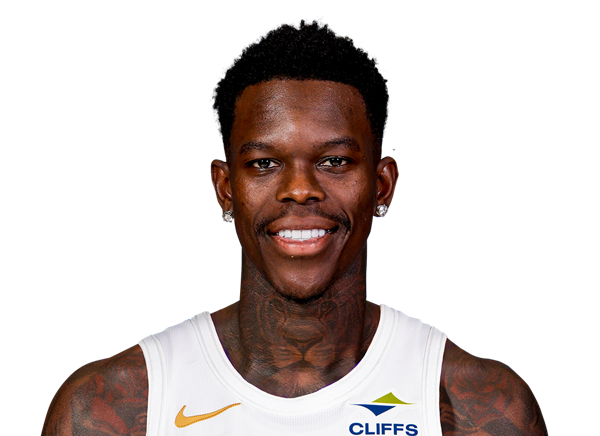
Dennis Schroder
#4

Sion James
#5
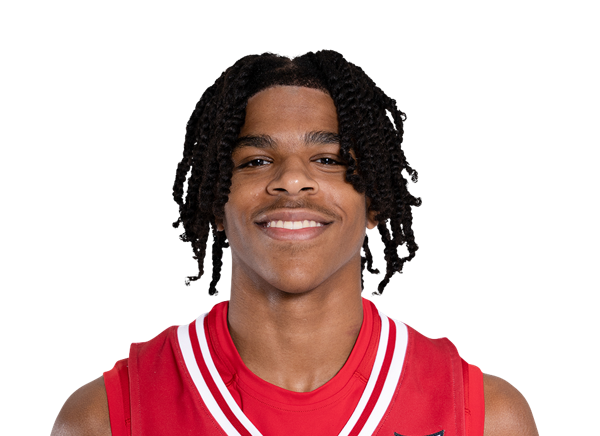
Christian Anderson
#33

Liam McNeeley
#3

Coby White
#7

Kon Knueppel
Forward
#7
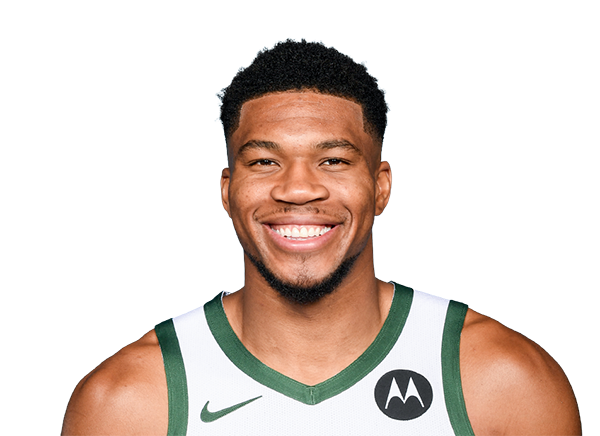
Giannis Antetokounmpo
#22

Andrew Wiggins
#95

Bobby Portis

Simone Fontecchio
#15
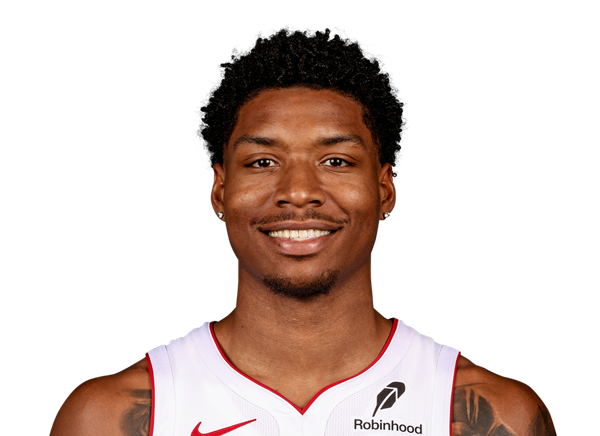
Myron Gardner
#5

Nikola Jovic
#16
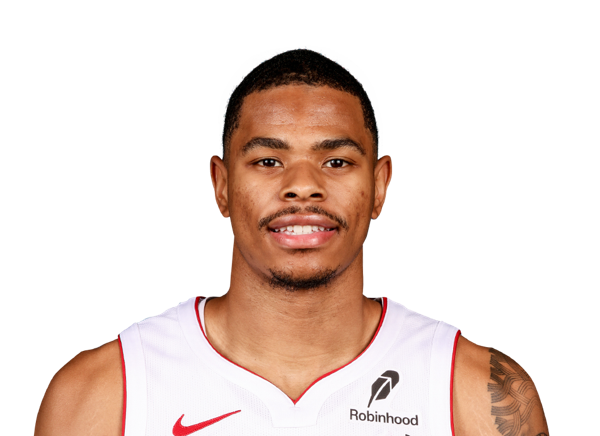
Keshad Johnson
Center
#13

Bam Adebayo
#8

Nick Richards
Guard
#2

Davion Mitchell
#11
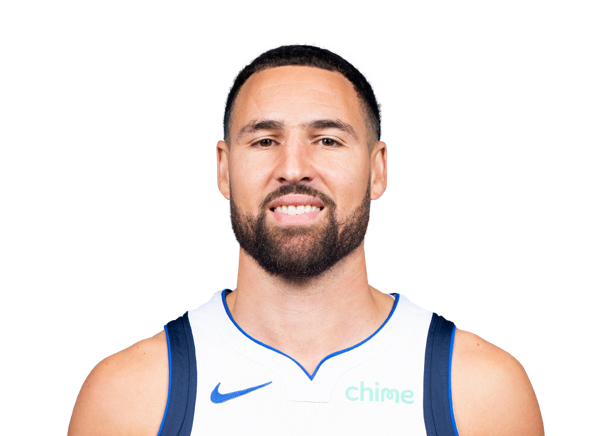
Klay Thompson
#9

Pelle Larsson
#4

Ryan Conwell
#10

Tim Hardaway Jr.
#12

Dru Smith
#24
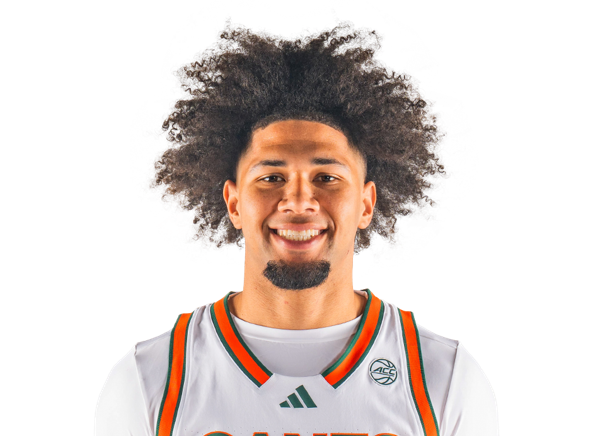
Tre Donaldson
Team Statistics
Hornets
12th in Eastern Conference Division
VS
Heat
6th in Eastern Conference Division
General
47.0
Rebounds Per Game
42.2
1.2
Assist To Turnover Ratio
2.1
21.0
Fouls Per Game
21.3
15
Games Played
15
0
Games Started
0
0
Minutes
0
0.0
Minutes Per Game
0.0
705
Rebounds
633
705
Rebounds
633
Offensive
81.4
Free Throw Percentage
74.4
31.0
3-Point Field Goal Percentage
35.2
35.3
Average Field Goals Made
42.1
87.5
Average Field Goals Attempted
89.0
14.1
Average 3-Point Field Goals Made
14.3
45.4
Average 3-Point Field Goals Attempted
40.7
15.2
Average Free Throws Made
21.9
18.7
Average Free Throws Attempted
29.5
99.9
Points Per Game
120.5
15.3
Offensive Rebounds Per Game
10.7
22.0
Assists Per Game
29.6
17.9
Turnovers Per Game
13.9
50.6
2-Point Field Goal Percentage
57.6
1.143
Scoring Efficiency
1.354
0.48
Shooting Efficiency
0.55
40.4
Field Goal Percentage
47.3
319.0
2-Point Field Goals Made
417.0
631.0
2-Point Field Goals Attempted
724.0
1499
Points
1808
229
Offensive Rebounds
160
330
Assists
444
269
Turnovers
209
530
Field Goals Made
632
1312
Field Goals Attempted
1335
228
Free Throws Made
329
280
Free Throws Attempted
442
211
3-Point Field Goals Made
215
681
3-Point Field Goals Attempted
611
31.0
3-Point Field Goal Percentage
35.2
21.3
2-Point Field Goals Made per Game
27.8
42.1
2-Point Field Goals Attempted per Game
48.3
Defensive
31.7
Defensive Rebounds Per Game
31.5
4.3
Blocks Per Game
5.7
6.9
Steals Per Game
7.9
476
Defensive Rebounds
473
103
Steals
119
65
Blocks
85