

Hornets vs Magic Live Score (24 Dec, 2026)
Game Information
League
NBA
Season
1
Date
December 23, 2026
Tipoff
7:00 PM EST
Status
Scheduled
Team Stats
 CHA
Game Comparison
ORL
-Points-
-Rebounds-
-Assists-
40Field Goal %46
-3-Point %-
-Free Throw %-
Game Leaders
CHAORL
 —#
Points
—
—#
—#
Rebounds
—
—#
—#
Assists
—
—#
Injury Report
H2H / Season Series
Last 5 Games









NBA Standings
Eastern Conference — Southeast
| Team | W | L | PCT | GB | STRK |
|---|---|---|---|---|---|
 Miami | 9 | 6 | .600 | - | W6 |
 Atlanta | 9 | 6 | .600 | - | W2 |
| Orlando | 6 | 8 | .429 | 2.5 | L1 |
 Washington | 5 | 11 | .313 | 4.5 | W1 |
| Charlotte | 4 | 10 | .286 | 4.5 | L3 |
Rosters
Hornets
12th in Eastern Conference Division
VS
Magic
8th in Eastern Conference Division
Forward
#24

Brandon Miller
#14

Moussa Diabate
#00

Royce O'Neale
#31

Tidjane Salaun
#2
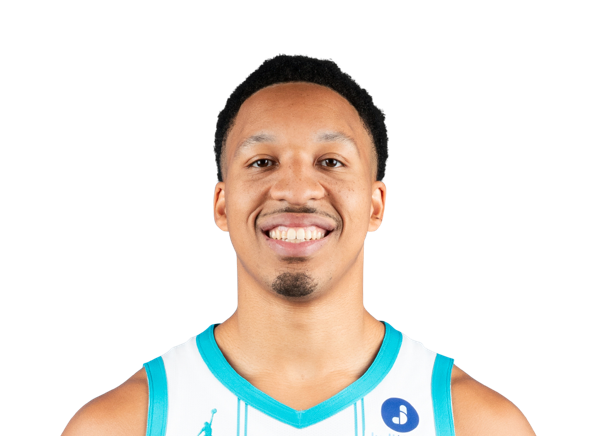
Grant Williams
#22

Hannes Steinbach
Center

Naz Reid
#11

Ryan Kalkbrenner
#16

PJ Hall
Guard
#8

Grayson Allen
#17
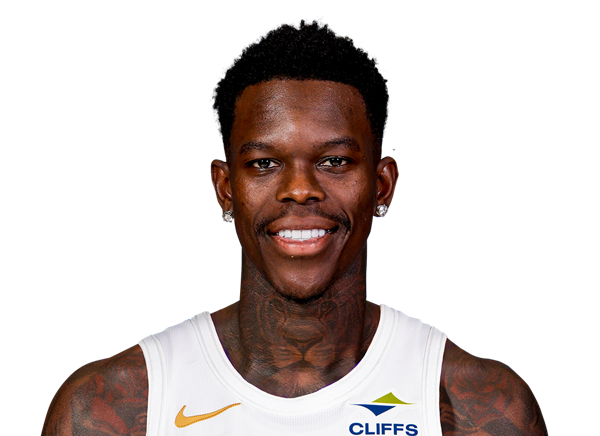
Dennis Schroder
#4

Sion James
#5
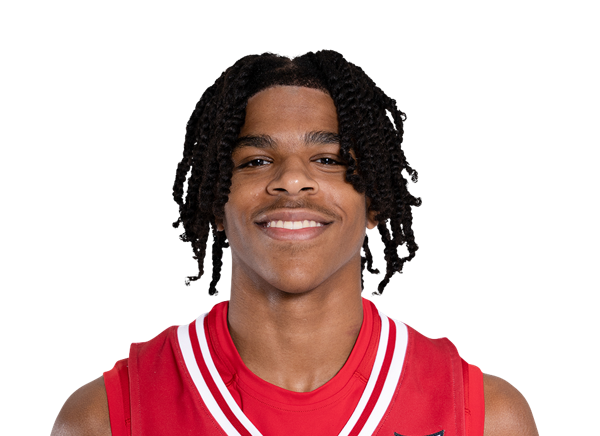
Christian Anderson
#33

Liam McNeeley
#3

Coby White
#7

Kon Knueppel
Forward
#22

Franz Wagner
#23
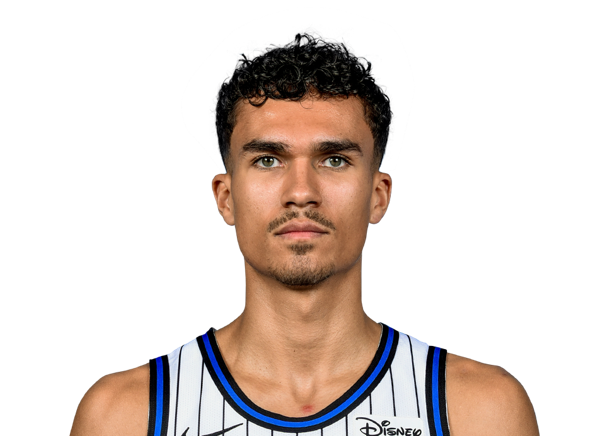
Tristan da Silva
#8

Jamal Cain
#5

Paolo Banchero
#1

Jonathan Isaac
#25

Izaiyah Nelson
#93
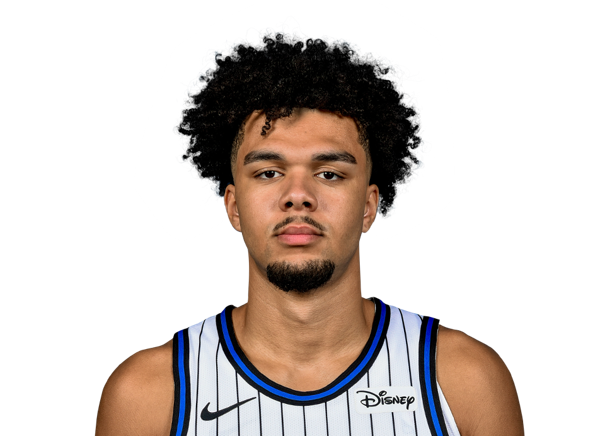
Noah Penda
Guard
#3

Desmond Bane
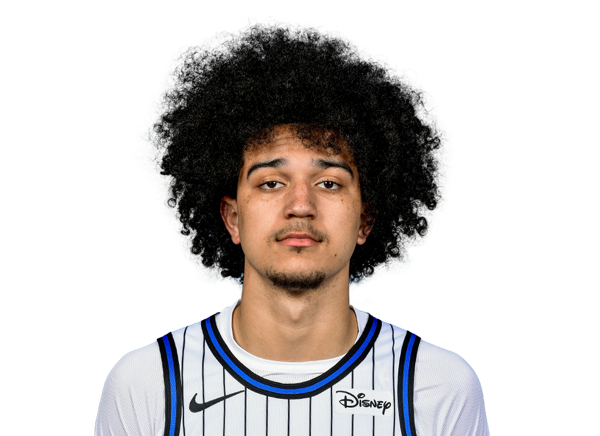
Anthony Black
#11
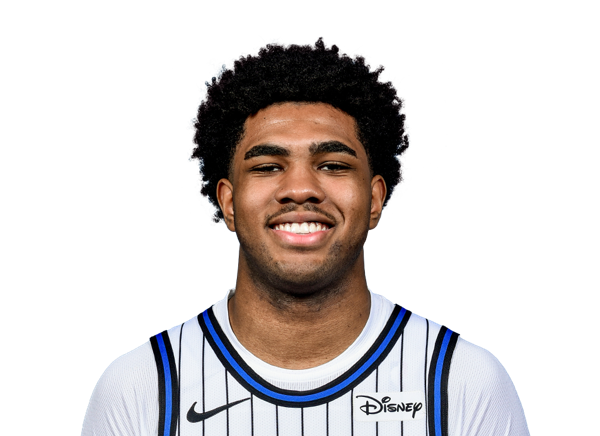
Jase Richardson
#2
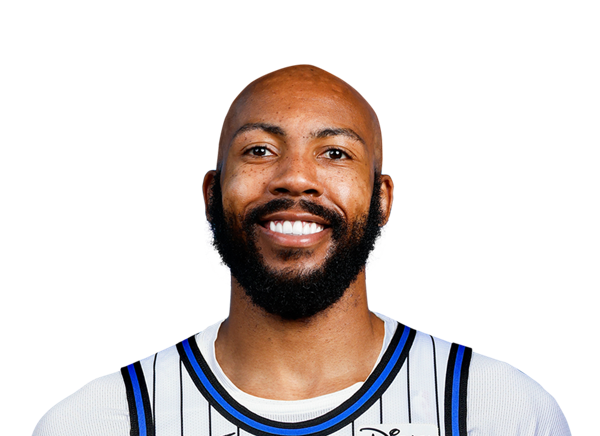
Jevon Carter
#4

Jalen Suggs
#30

Alex Morales
Center
#34
Wendell Carter Jr.
#35

Goga Bitadze
#9

Nikola Vucevic
#14

Colin Castleton
Team Statistics
Hornets
12th in Eastern Conference Division
VS
Magic
8th in Eastern Conference Division
General
47.0
Rebounds Per Game
42.6
1.2
Assist To Turnover Ratio
1.7
21.0
Fouls Per Game
22.5
15
Games Played
15
0
Games Started
0
0
Minutes
0
0.0
Minutes Per Game
0.0
705
Rebounds
639
705
Rebounds
639
Offensive
81.4
Free Throw Percentage
76.5
31.0
3-Point Field Goal Percentage
35.8
35.3
Average Field Goals Made
39.0
87.5
Average Field Goals Attempted
85.1
14.1
Average 3-Point Field Goals Made
14.5
45.4
Average 3-Point Field Goals Attempted
40.5
15.2
Average Free Throws Made
17.1
18.7
Average Free Throws Attempted
22.4
99.9
Points Per Game
109.6
15.3
Offensive Rebounds Per Game
10.9
22.0
Assists Per Game
26.5
17.9
Turnovers Per Game
15.5
50.6
2-Point Field Goal Percentage
54.9
1.143
Scoring Efficiency
1.287
0.48
Shooting Efficiency
0.54
40.4
Field Goal Percentage
45.8
319.0
2-Point Field Goals Made
368.0
631.0
2-Point Field Goals Attempted
670.0
1499
Points
1644
229
Offensive Rebounds
163
330
Assists
398
269
Turnovers
232
530
Field Goals Made
585
1312
Field Goals Attempted
1277
228
Free Throws Made
257
280
Free Throws Attempted
336
211
3-Point Field Goals Made
217
681
3-Point Field Goals Attempted
607
31.0
3-Point Field Goal Percentage
35.7
21.3
2-Point Field Goals Made per Game
24.5
42.1
2-Point Field Goals Attempted per Game
44.7
Defensive
31.7
Defensive Rebounds Per Game
31.7
4.3
Blocks Per Game
4.3
6.9
Steals Per Game
7.6
476
Defensive Rebounds
476
103
Steals
114
65
Blocks
65