

Kings vs Bucks Live Score (10 Feb, 2027)
Game Information
League
NBA
Season
1
Date
February 9, 2027
Tipoff
8:00 PM EST
Status
Scheduled
Team Stats
 SAC
Game Comparison
MIL
-Points-
-Rebounds-
-Assists-
46Field Goal %43
-3-Point %-
-Free Throw %-
Game Leaders
SACMIL
 —#
Points
—
—#
—#
Rebounds
—
—#
—#
Assists
—
—#
Injury Report
H2H / Season Series
Last 5 Games








NBA Standings
Western Conference — Pacific
| Team | W | L | PCT | GB | STRK |
|---|---|---|---|---|---|
 LA Lakers | 10 | 2 | .833 | - | W6 |
 Golden State | 8 | 3 | .727 | 1.5 | W8 |
 Phoenix | 4 | 6 | .400 | 5 | W1 |
 LA Clippers | 2 | 8 | .200 | 7 | L1 |
| Sacramento | 1 | 10 | .091 | 8.5 | L4 |




Rosters
Kings
5th in Pacific Division
VS
Bucks
5th in Central Division
Guard
#5
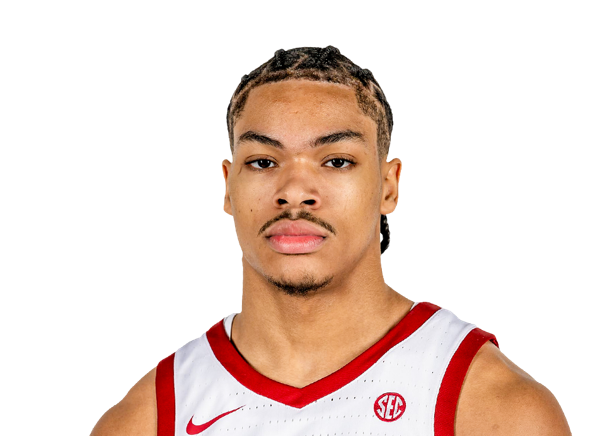
Darius Acuff Jr.
#8

Zach LaVine
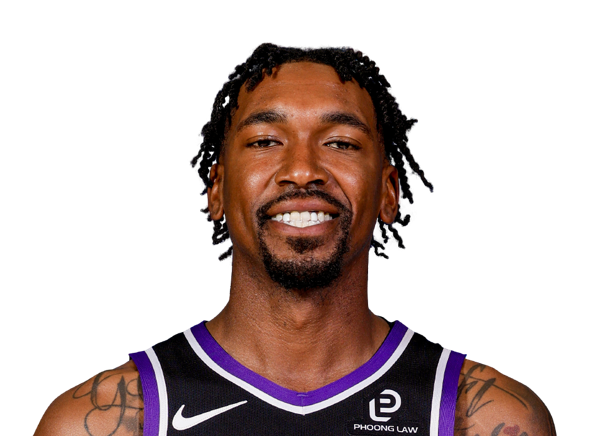
Malik Monk
#34

Emanuel Sharp
#29

Daeqwon Plowden
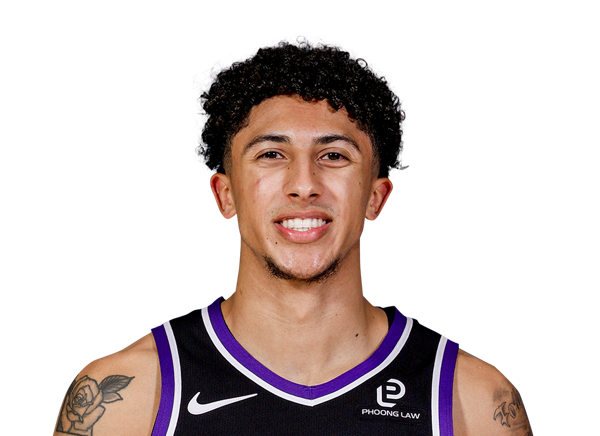
Nique Clifford
#25
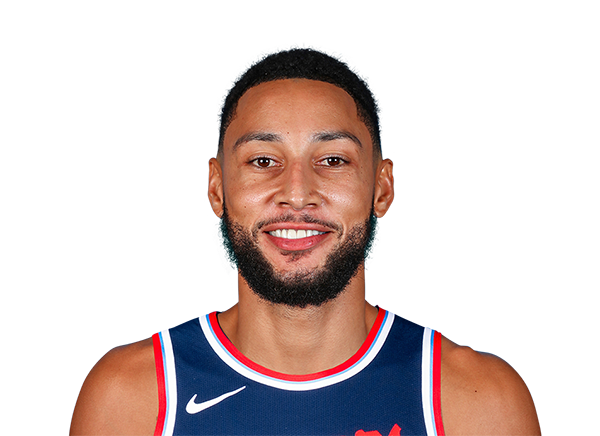
Ben Simmons
Forward
#15

De'Andre Hunter
#11

Domantas Sabonis
#9
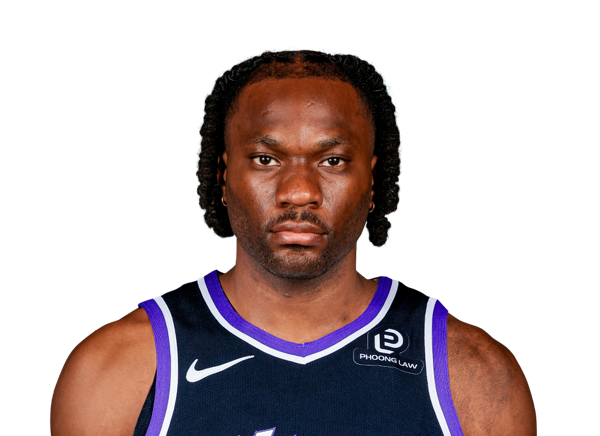
Precious Achiuwa
#19
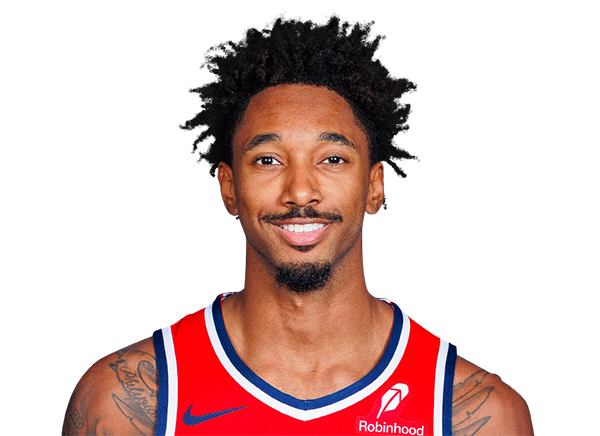
Leaky Black
#13
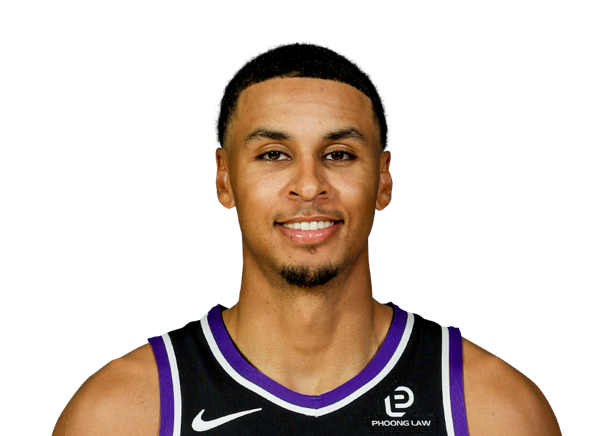
Keegan Murray
#22

Jonathan Mogbo
#33
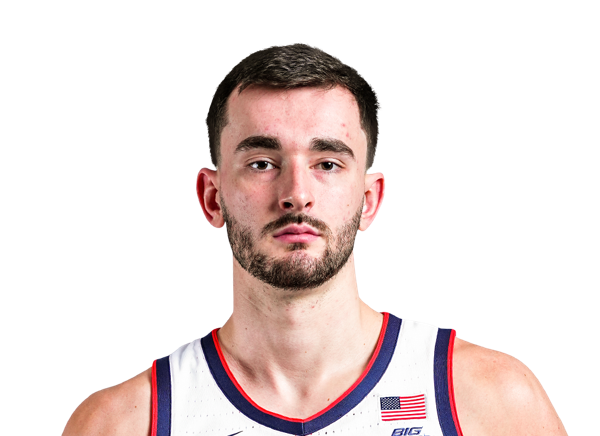
Alex Karaban
Center
#32
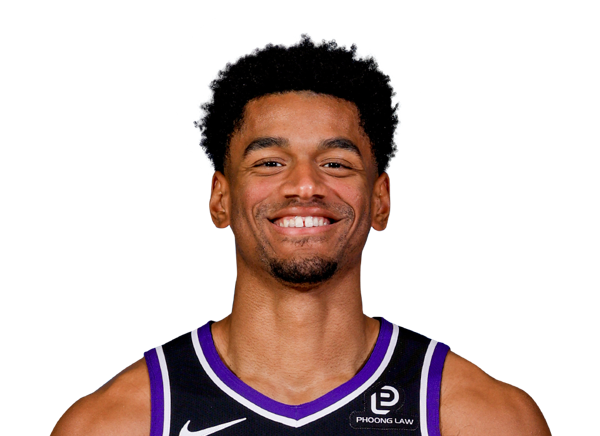
Dylan Cardwell
#24

Mason Plumlee
#42

Maxime Raynaud
Guard
#11
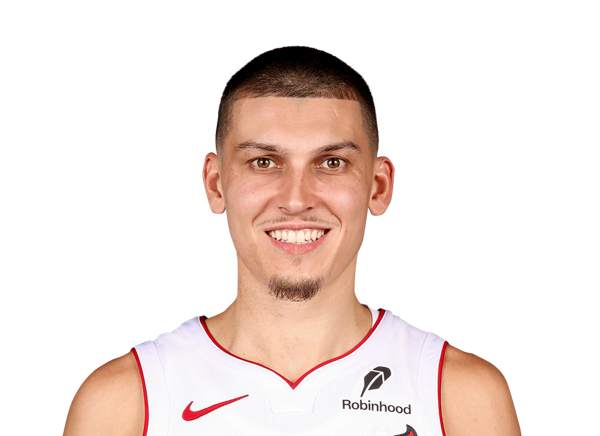
Tyler Herro
#13
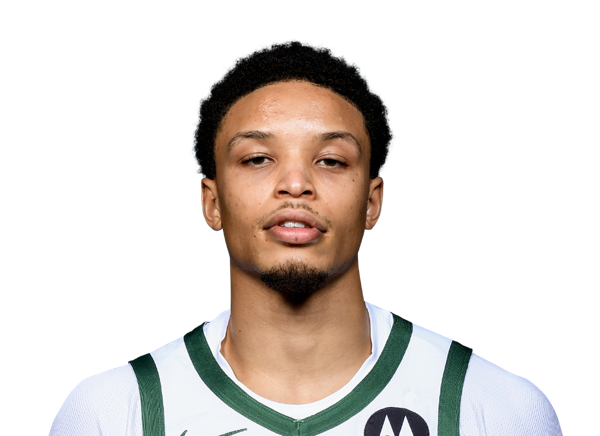
Ryan Rollins
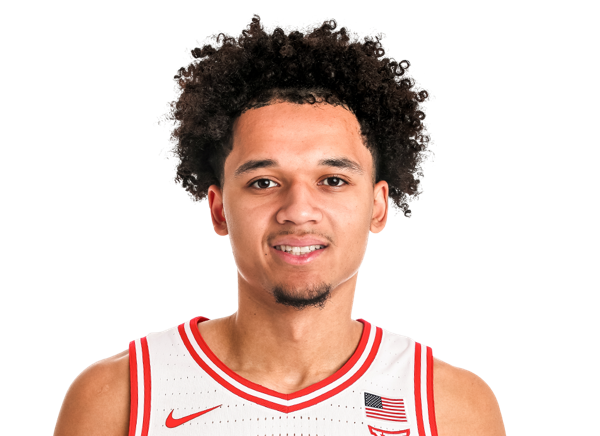
Brayden Burries
#25

Kasparas Jakucionis
#20

AJ Green
#5
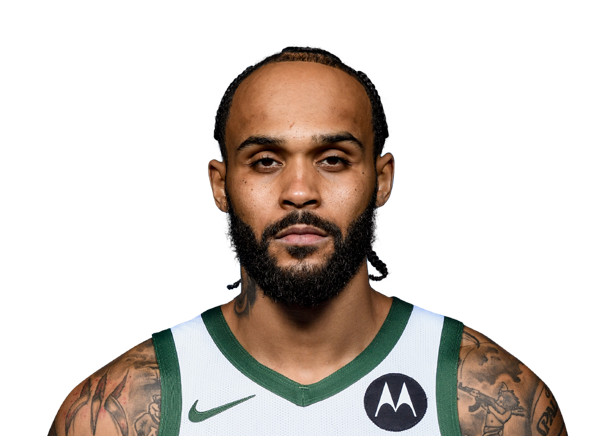
Gary Trent Jr.
Forward
#24

Jaime Jaquez Jr.
#18
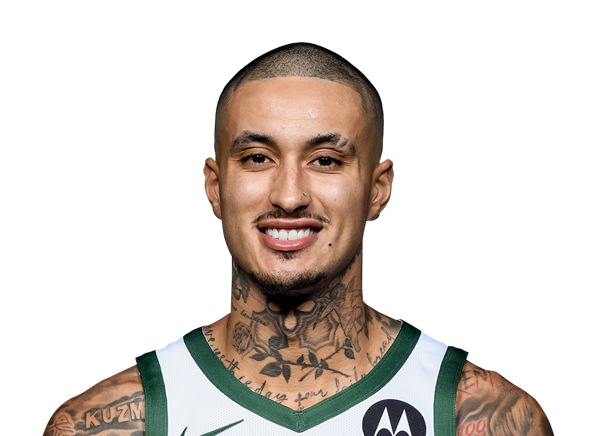
Kyle Kuzma
#15
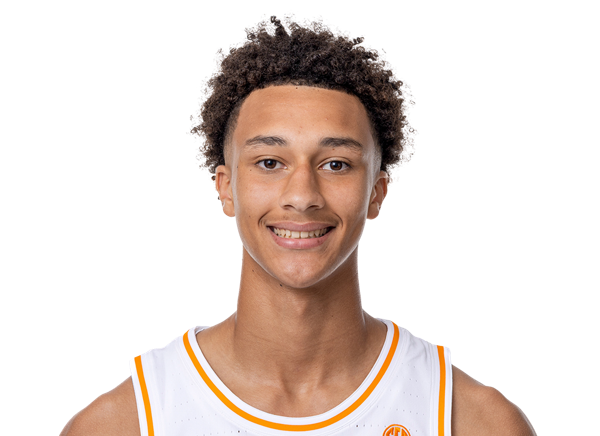
Nate Ament
#21

Ousmane Dieng
#35

Pete Nance
#23
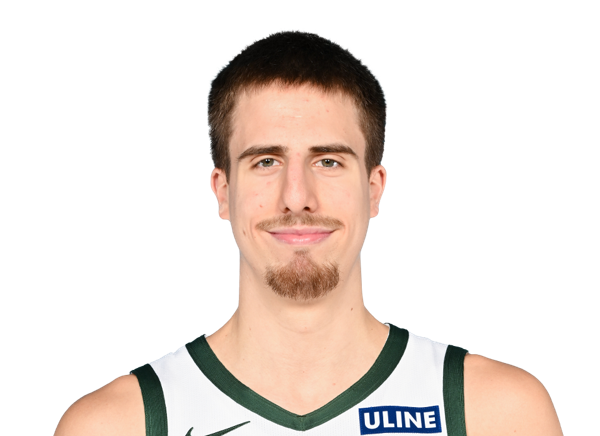
Bogoljub Markovic
Center
#9
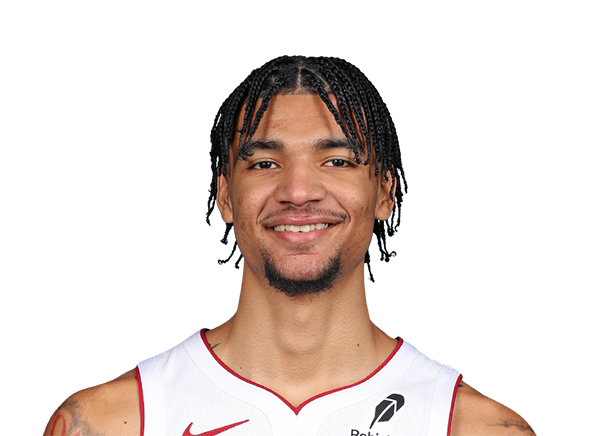
Kel'el Ware
#3

Myles Turner
#00

Jericho Sims
Team Statistics
Kings
5th in Pacific Division
VS
Bucks
5th in Central Division
General
39.7
Rebounds Per Game
45.4
1.6
Assist To Turnover Ratio
1.5
22.9
Fouls Per Game
22.6
13
Games Played
14
0
Games Started
0
0
Minutes
0
0.0
Minutes Per Game
0.0
516
Rebounds
635
516
Rebounds
635
Offensive
76.7
Free Throw Percentage
74.3
34.3
3-Point Field Goal Percentage
34.1
39.1
Average Field Goals Made
37.7
85.9
Average Field Goals Attempted
88.9
12.4
Average 3-Point Field Goals Made
15.0
36.1
Average 3-Point Field Goals Attempted
44.0
17.2
Average Free Throws Made
15.7
22.5
Average Free Throws Attempted
21.1
107.8
Points Per Game
106.1
9.8
Offensive Rebounds Per Game
13.6
25.2
Assists Per Game
24.6
16.2
Turnovers Per Game
16.1
53.5
2-Point Field Goal Percentage
50.6
1.254
Scoring Efficiency
1.195
0.53
Shooting Efficiency
0.51
45.5
Field Goal Percentage
42.4
347.0
2-Point Field Goals Made
318.0
648.0
2-Point Field Goals Attempted
628.0
1401
Points
1486
127
Offensive Rebounds
190
327
Assists
345
210
Turnovers
225
508
Field Goals Made
528
1117
Field Goals Attempted
1244
224
Free Throws Made
220
292
Free Throws Attempted
296
161
3-Point Field Goals Made
210
469
3-Point Field Goals Attempted
616
34.3
3-Point Field Goal Percentage
34.1
26.7
2-Point Field Goals Made per Game
22.7
49.8
2-Point Field Goals Attempted per Game
44.9
Defensive
29.9
Defensive Rebounds Per Game
31.8
3.5
Blocks Per Game
4.6
7.8
Steals Per Game
6.9
389
Defensive Rebounds
445
102
Steals
96
45
Blocks
65