

Heat vs Kings Live Score (9 Nov, 2026)
Game Information
League
NBA
Season
2027
Date
November 8, 2026
Tipoff
9:00 PM EST
Status
Scheduled
MIA Record
3-6
SAC Record
1-8
Venue
Golden 1 Center
Location
Sacramento, CA
Arena Type
Indoor
Team Stats
 MIA
Game Comparison
SAC

-Points-
-Rebounds-
-Assists-
46Field Goal %46
-3-Point %-
-Free Throw %-
Game Leaders
MIASAC
 —#
Points
—
—#
—#Rebounds
—
—#
—#Assists
—
—#
Injury Report
H2H / Season Series
Last 5 Games





NBA Standings
Eastern Conference — Southeast
| Team | W | L | PCT | GB | STRK |
|---|---|---|---|---|---|
 Atlanta | 7 | 4 | .636 | - | W4 |
 Washington | 4 | 6 | .400 | 2.5 | L3 |
| Miami | 3 | 6 | .333 | 3 | L1 |
 Charlotte | 3 | 7 | .300 | 3.5 | L6 |
 Orlando | 2 | 7 | .222 | 4 | L4 |
Western Conference — Pacific
| Team | W | L | PCT | GB | STRK |
|---|---|---|---|---|---|
 LA Lakers | 8 | 2 | .800 | - | W4 |
 Golden State | 7 | 3 | .700 | 1 | W7 |
 Phoenix | 3 | 5 | .375 | 4 | W2 |
 LA Clippers | 1 | 7 | .125 | 6 | L7 |
| Sacramento | 1 | 8 | .111 | 6.5 | L2 |
Rosters
Heat
9th in Eastern Conference Division
VS
Kings
5th in Pacific Division
Forward
#7
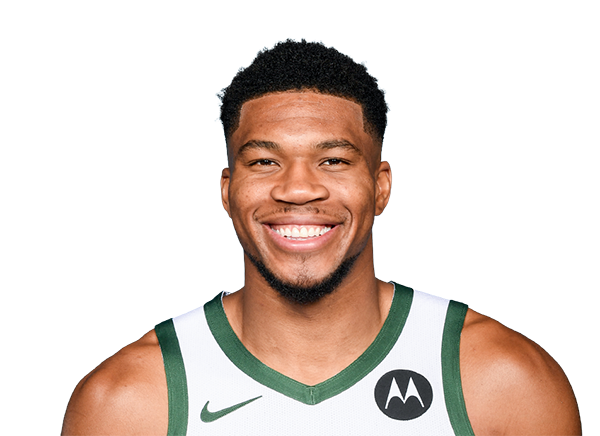
Giannis Antetokounmpo
#22
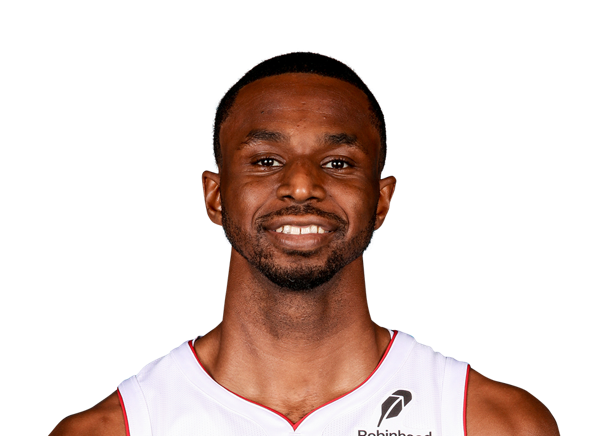
Andrew Wiggins
#95
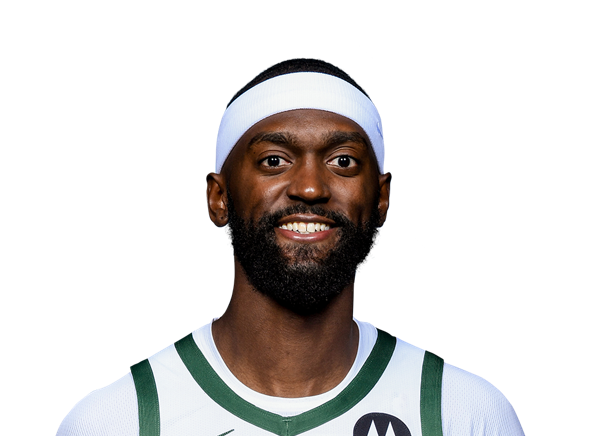
Bobby Portis
#5
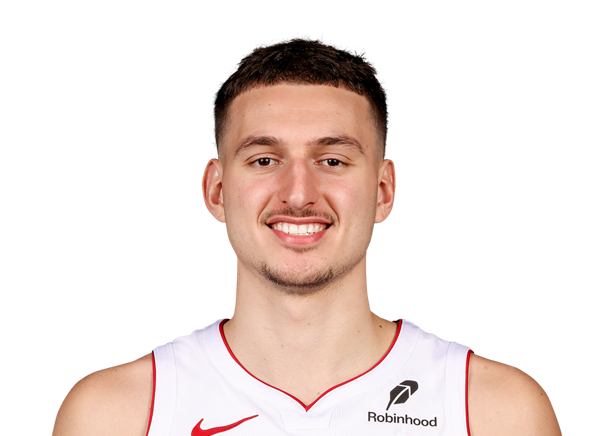
Nikola Jovic
#15
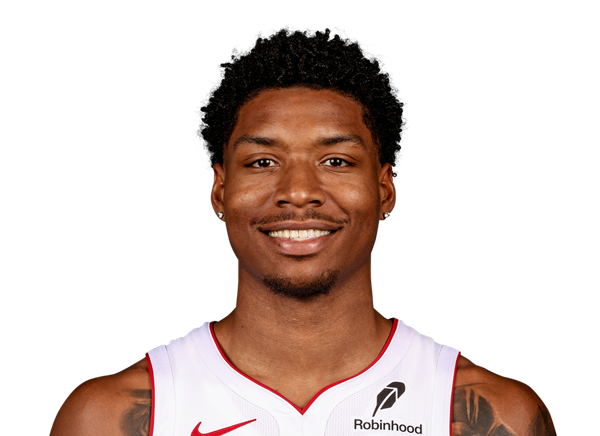
Myron Gardner

Simone Fontecchio
Center
#13

Bam Adebayo
#8

Nick Richards
Guard
#2

Davion Mitchell
#11
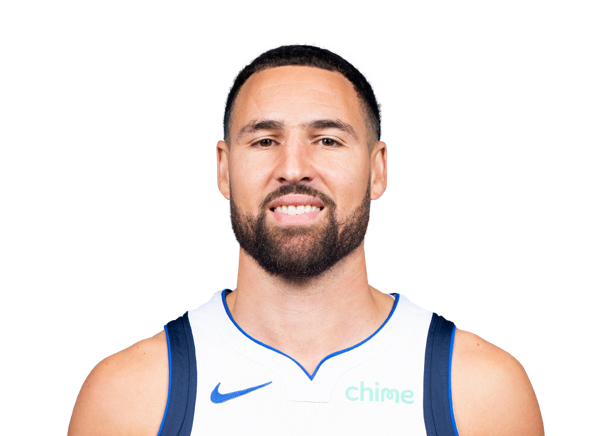
Klay Thompson
#9
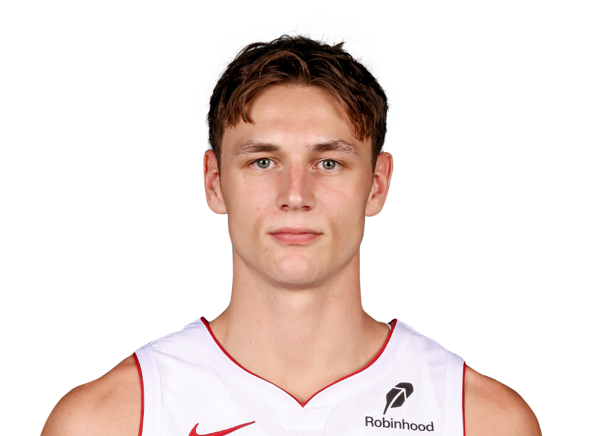
Pelle Larsson
#10
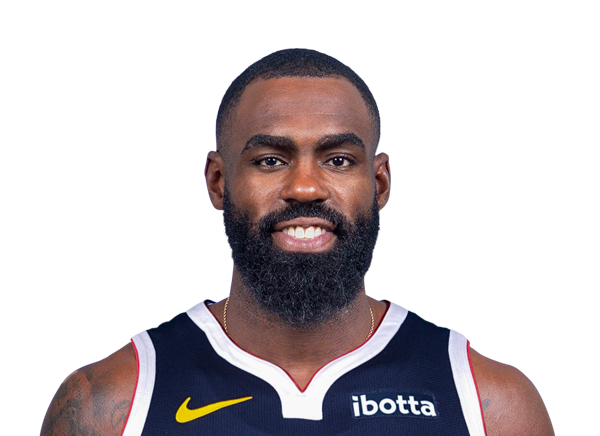
Tim Hardaway Jr.
#4
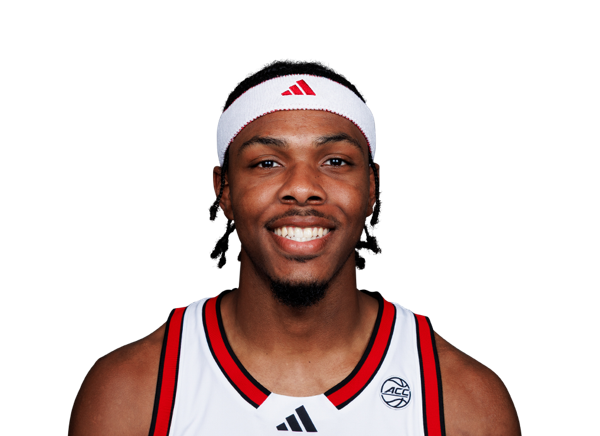
Ryan Conwell
#12

Dru Smith
Guard
#5
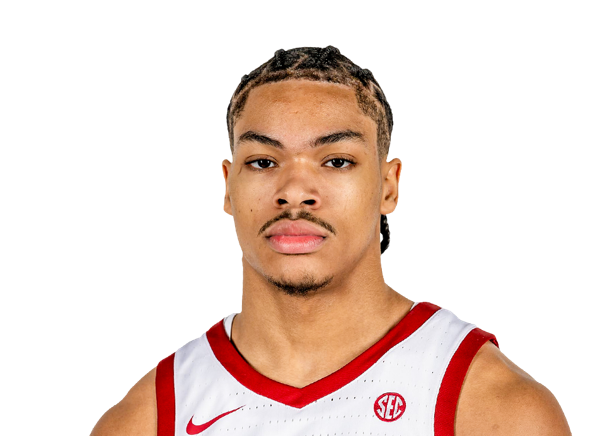
Darius Acuff Jr.
#8

Zach LaVine
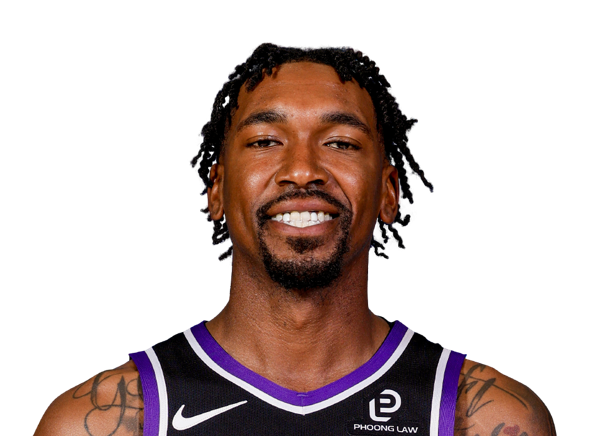
Malik Monk
#34
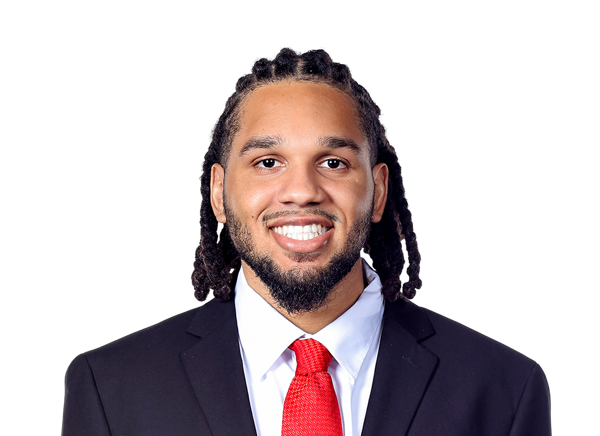
Emanuel Sharp
#29
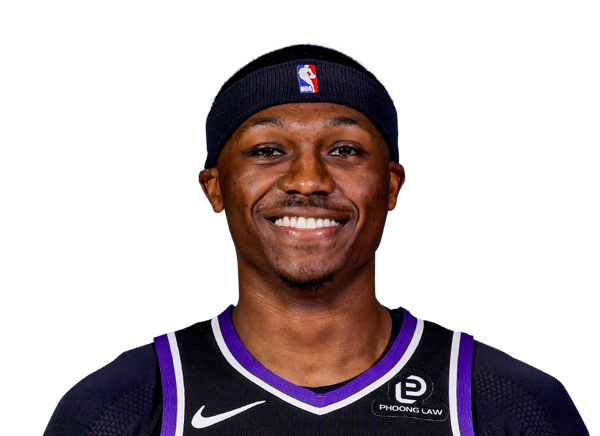
Daeqwon Plowden
#10
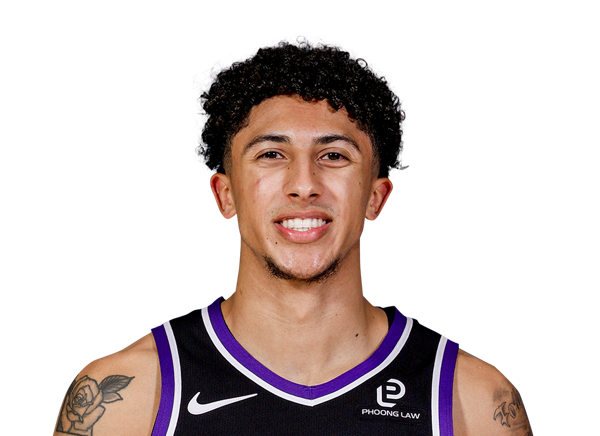
Nique Clifford
#25
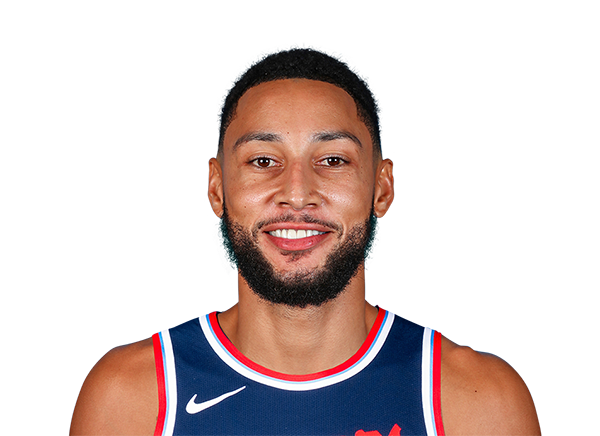
Ben Simmons
Forward
#11
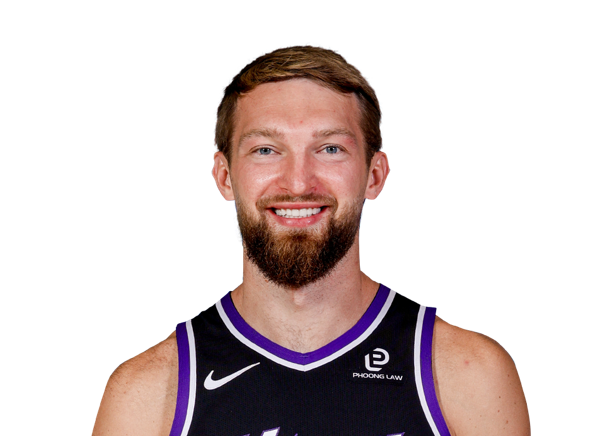
Domantas Sabonis
#15

De'Andre Hunter
#9
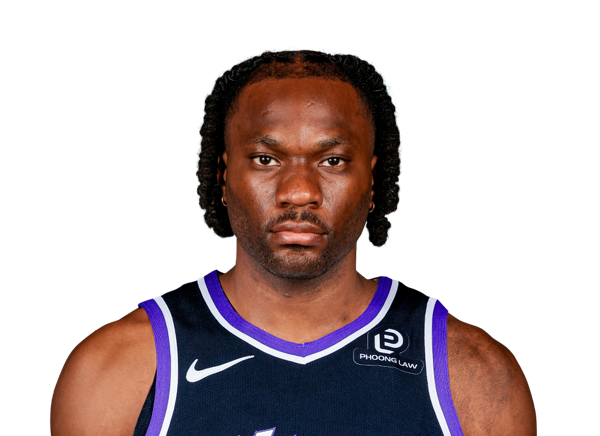
Precious Achiuwa
#13
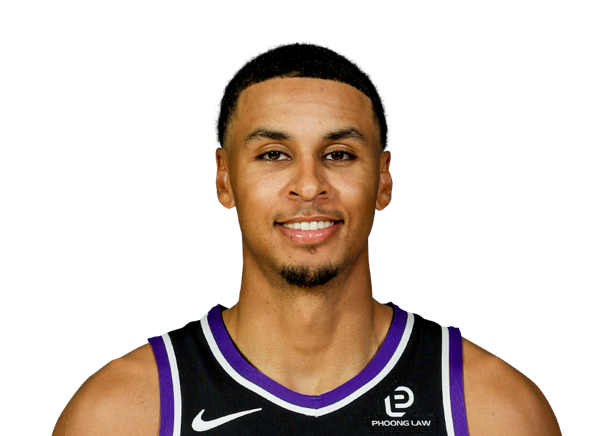
Keegan Murray
#19
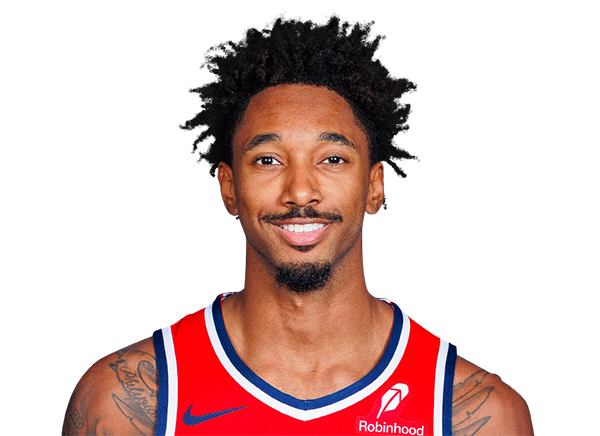
Leaky Black
#22
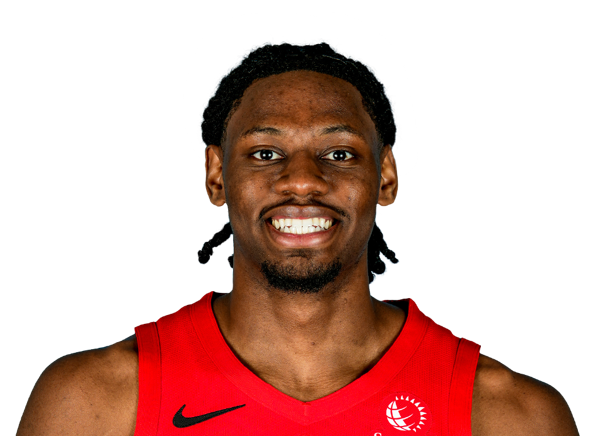
Jonathan Mogbo
#33
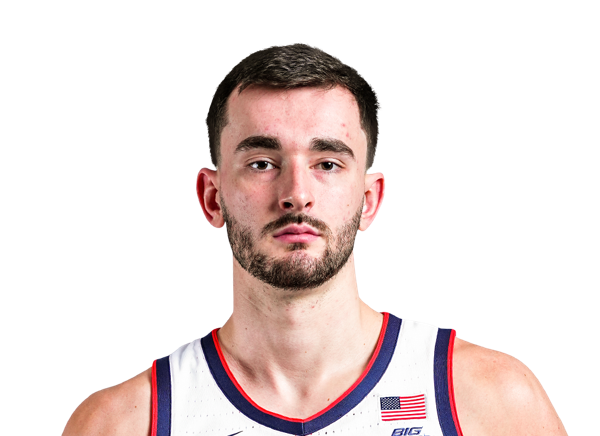
Alex Karaban
Center
#32
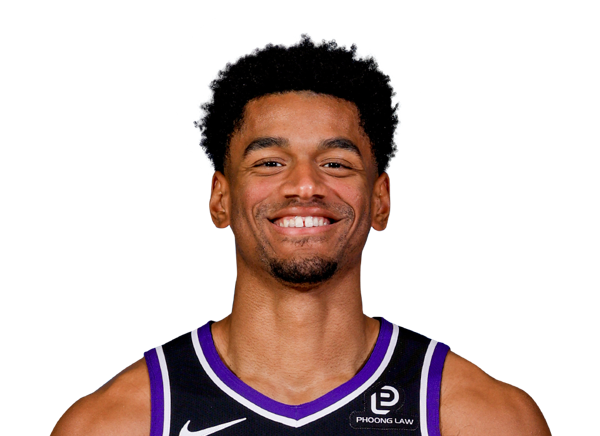
Dylan Cardwell
#42

Maxime Raynaud
Team Statistics
Heat
9th in Eastern Conference Division
VS
Kings
5th in Pacific Division
General
42.8
Rebounds Per Game
40.3
1.9
Assist To Turnover Ratio
1.6
20.9
Fouls Per Game
23.8
9
Games Played
9
0
Games Started
0
0
Minutes
0
0.0
Minutes Per Game
0.0
385
Rebounds
363
385
Rebounds
363
Offensive
73.9
Free Throw Percentage
74.5
33.1
3-Point Field Goal Percentage
34.0
41.9
Average Field Goals Made
40.1
90.1
Average Field Goals Attempted
88.0
13.0
Average 3-Point Field Goals Made
12.1
39.3
Average 3-Point Field Goals Attempted
35.7
19.2
Average Free Throws Made
16.9
26.0
Average Free Throws Attempted
22.7
116.0
Points Per Game
109.2
10.6
Offensive Rebounds Per Game
10.7
29.2
Assists Per Game
25.3
15.2
Turnovers Per Game
15.6
56.9
2-Point Field Goal Percentage
53.5
1.287
Scoring Efficiency
1.241
0.54
Shooting Efficiency
0.52
46.5
Field Goal Percentage
45.6
260.0
2-Point Field Goals Made
252.0
457.0
2-Point Field Goals Attempted
471.0
1044
Points
983
95
Offensive Rebounds
96
263
Assists
228
137
Turnovers
140
377
Field Goals Made
361
811
Field Goals Attempted
792
173
Free Throws Made
152
234
Free Throws Attempted
204
117
3-Point Field Goals Made
109
354
3-Point Field Goals Attempted
321
33.1
3-Point Field Goal Percentage
34.0
28.9
2-Point Field Goals Made per Game
28.0
50.8
2-Point Field Goals Attempted per Game
52.3
Defensive
32.2
Defensive Rebounds Per Game
29.7
5.1
Blocks Per Game
3.0
8.3
Steals Per Game
7.6
290
Defensive Rebounds
267
75
Steals
68
46
Blocks
27