

Kings vs Wizards Live Score (29 Jan, 2027)
Game Information
League
NBA
Season
1
Date
January 28, 2027
Tipoff
7:00 PM EST
Status
Scheduled
Team Stats
 SAC
Game Comparison
WSH

-Points-
-Rebounds-
-Assists-
46Field Goal %48
-3-Point %-
-Free Throw %-
Game Leaders
SACWSH
 —#
Points
—
—#
—#Rebounds
—
—#
—#Assists
—
—#
Injury Report
H2H / Season Series
Last 5 Games







NBA Standings
Western Conference — Pacific
| Team | W | L | PCT | GB | STRK |
|---|---|---|---|---|---|
 LA Lakers | 4 | 1 | .800 | - | W1 |
 Golden State | 2 | 3 | .400 | 2 | W2 |
 Phoenix | 1 | 2 | .333 | 2 | L1 |
 LA Clippers | 1 | 3 | .250 | 2.5 | L3 |
| Sacramento | 0 | 5 | .000 | 4 | L5 |
Eastern Conference — Southeast
| Team | W | L | PCT | GB | STRK |
|---|---|---|---|---|---|
 Charlotte | 3 | 2 | .600 | - | L1 |
 Atlanta | 3 | 3 | .500 | 0.5 | W1 |
| Washington | 2 | 3 | .400 | 1 | L2 |
 Orlando | 1 | 3 | .250 | 1.5 | L1 |
 Miami | 1 | 4 | .200 | 2 | W1 |
Rosters
Kings
4th in Pacific Division
VS
Wizards
5th in Eastern Conference Division
Guard
#5
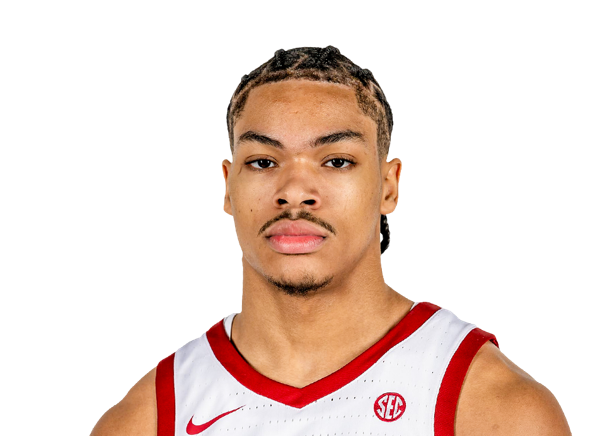
Darius Acuff Jr.
#8

Zach LaVine
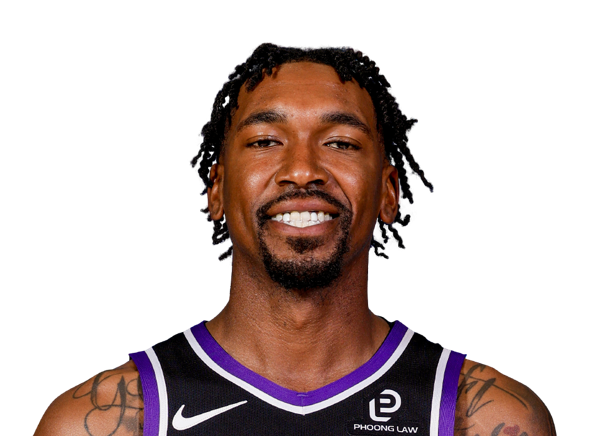
Malik Monk
#34

Emanuel Sharp
#29
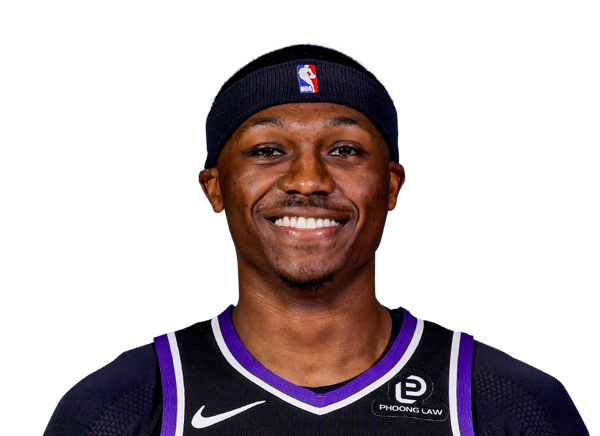
Daeqwon Plowden
#10
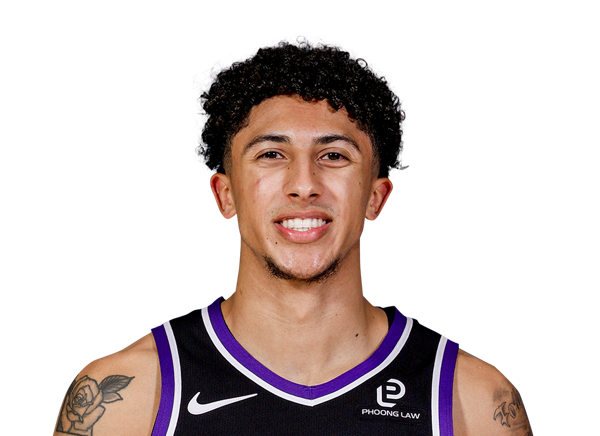
Nique Clifford
#25
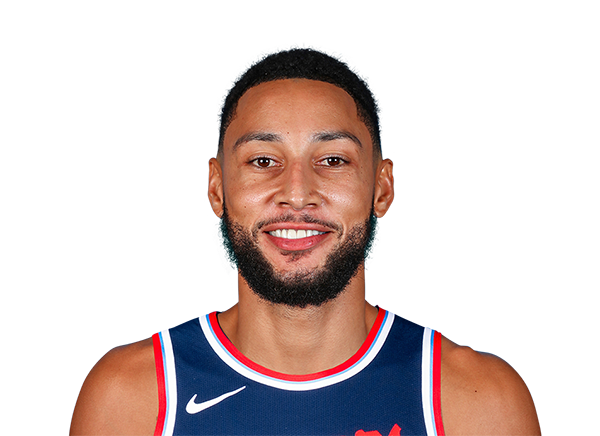
Ben Simmons
Forward
#11
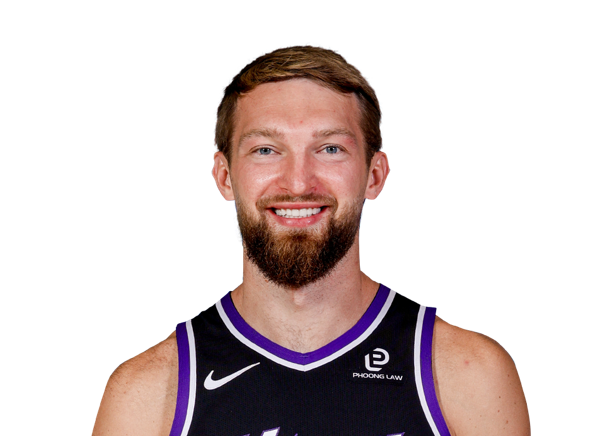
Domantas Sabonis
#15

De'Andre Hunter
#9
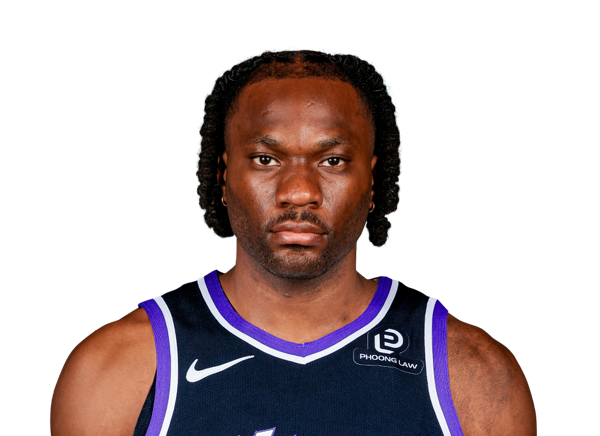
Precious Achiuwa
#13
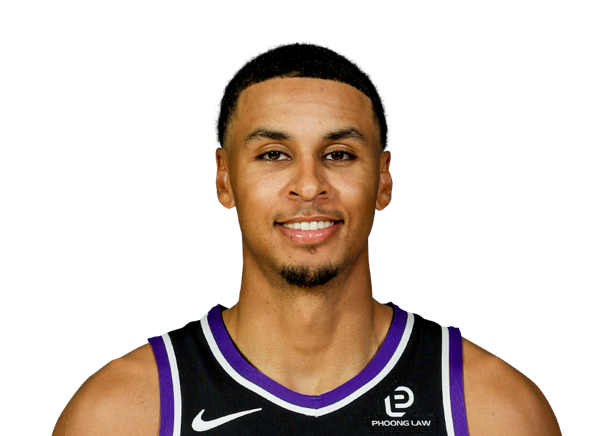
Keegan Murray
#19
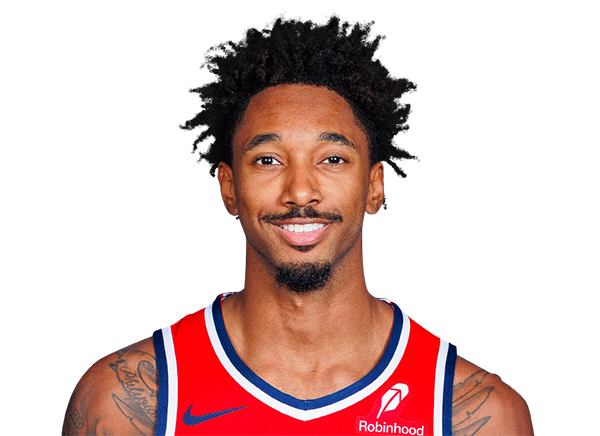
Leaky Black
#22

Jonathan Mogbo
#33
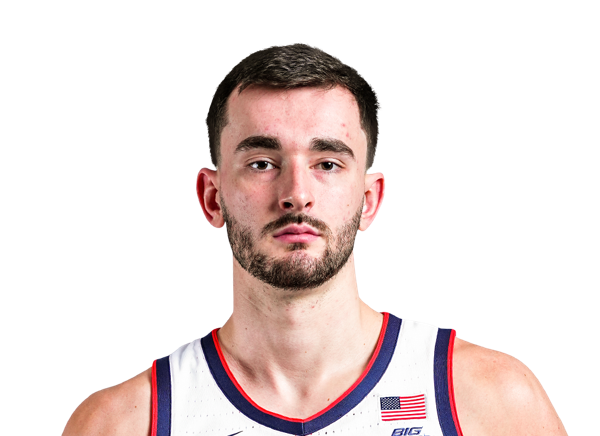
Alex Karaban
Center
#32
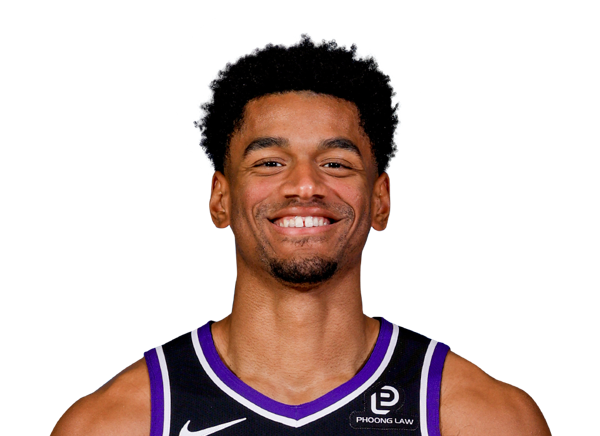
Dylan Cardwell
#42

Maxime Raynaud
Forward
#23

Anthony Davis
#18
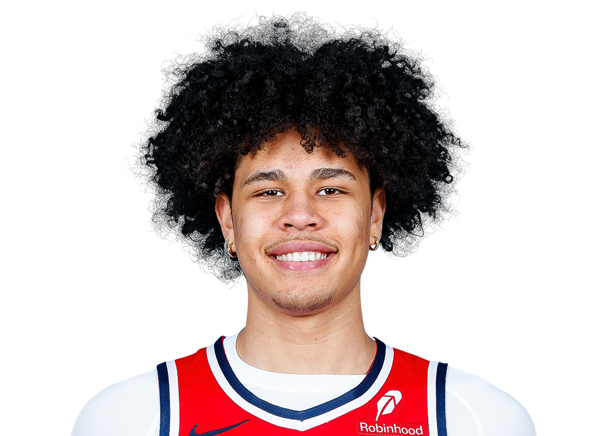
Kyshawn George
#22

Khris Middleton
#4

AJ Dybantsa
#9
Justin Champagnie
#34
Felix Okpara
#16

Anthony Gill
#00
Tristan Vukcevic
Guard
#3

Trae Young
#12
Tre Johnson

Bilal Coulibaly
#7
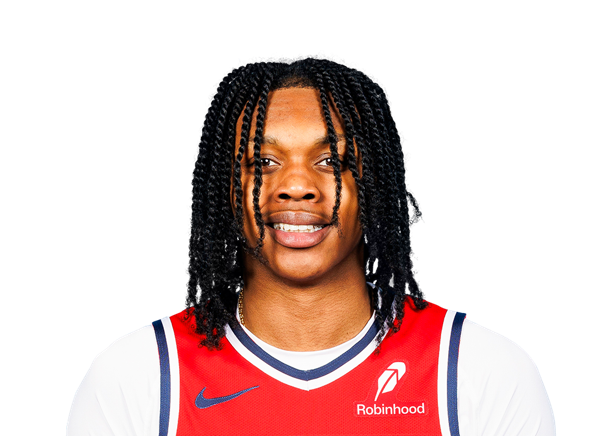
Bub Carrington
#27
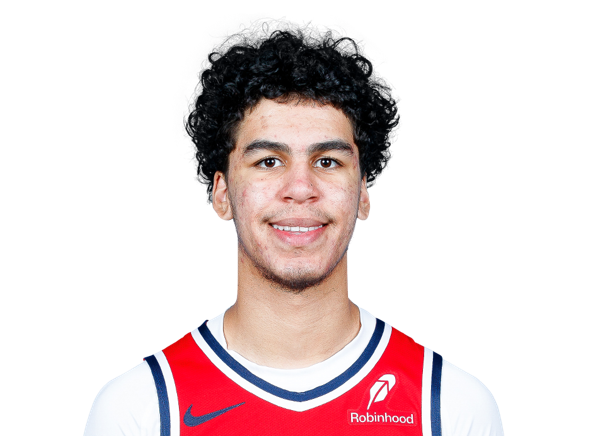
Will Riley
#1
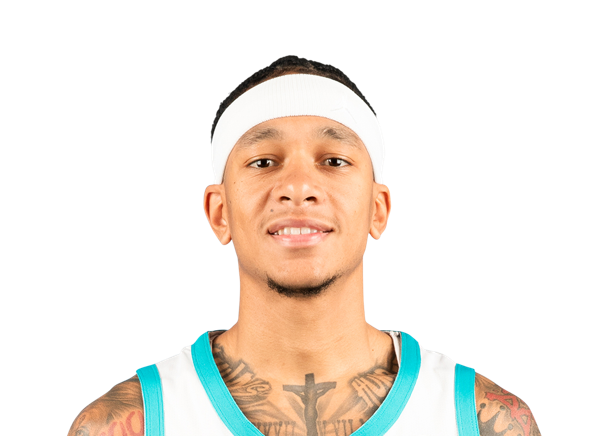
Tre Mann
#26
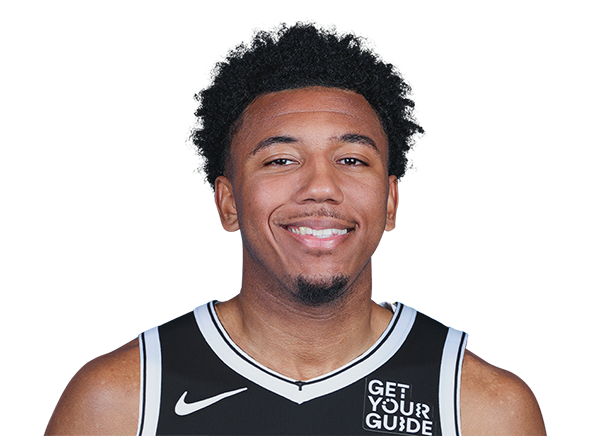
Reece Beekman
#5
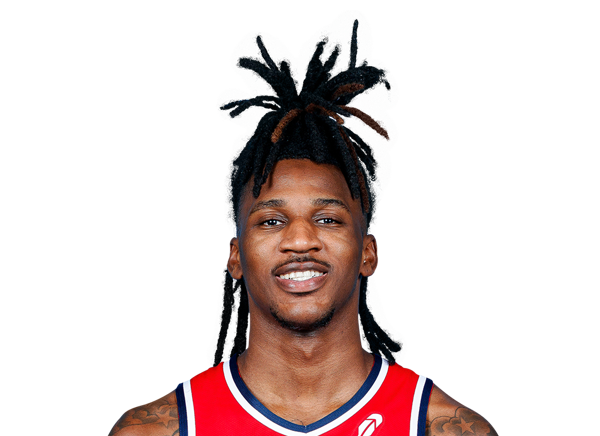
Jamir Watkins
Center
#20

Alex Sarr
#8
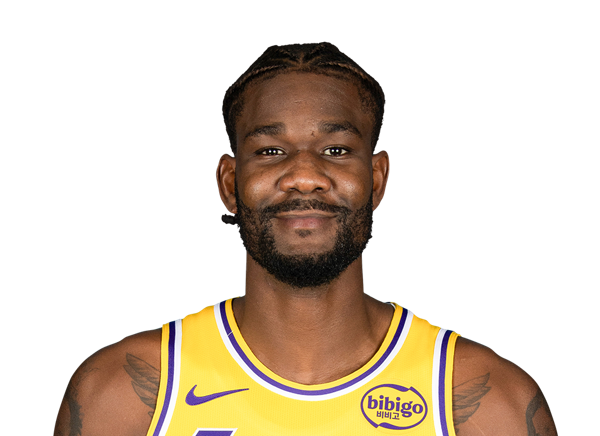
Deandre Ayton
Team Statistics
Kings
4th in Pacific Division
VS
Wizards
5th in Eastern Conference Division
General
40.9
Rebounds Per Game
41.0
1.5
Assist To Turnover Ratio
1.8
23.5
Fouls Per Game
20.4
8
Games Played
8
0
Games Started
0
0
Minutes
0
0.0
Minutes Per Game
0.0
327
Rebounds
328
327
Rebounds
328
Offensive
75.1
Free Throw Percentage
81.4
32.5
3-Point Field Goal Percentage
29.4
40.1
Average Field Goals Made
39.4
88.8
Average Field Goals Attempted
82.8
11.6
Average 3-Point Field Goals Made
8.8
35.8
Average 3-Point Field Goals Attempted
29.8
17.4
Average Free Throws Made
21.4
23.1
Average Free Throws Attempted
26.3
109.3
Points Per Game
108.9
11.1
Offensive Rebounds Per Game
8.4
24.4
Assists Per Game
24.8
16.1
Turnovers Per Game
13.5
53.8
2-Point Field Goal Percentage
57.8
1.231
Scoring Efficiency
1.316
0.52
Shooting Efficiency
0.53
45.2
Field Goal Percentage
47.6
228.0
2-Point Field Goals Made
245.0
424.0
2-Point Field Goals Attempted
424.0
874
Points
871
89
Offensive Rebounds
67
195
Assists
198
129
Turnovers
108
321
Field Goals Made
315
710
Field Goals Attempted
662
139
Free Throws Made
171
185
Free Throws Attempted
210
93
3-Point Field Goals Made
70
286
3-Point Field Goals Attempted
238
32.5
3-Point Field Goal Percentage
29.4
28.5
2-Point Field Goals Made per Game
30.6
53.0
2-Point Field Goals Attempted per Game
53.0
Defensive
29.8
Defensive Rebounds Per Game
32.6
2.9
Blocks Per Game
5.8
7.8
Steals Per Game
7.6
238
Defensive Rebounds
261
62
Steals
61
23
Blocks
46