

Magic vs Clippers Live Score (16 Jan, 2027)
Game Information
League
NBA
Season
1
Date
January 15, 2027
Tipoff
10:30 PM EST
Status
Scheduled
Team Stats
 ORL
Game Comparison
LAC

-Points-
-Rebounds-
-Assists-
-Field Goal %-
-3-Point %-
-Free Throw %-
Injury Report
Orlando Magic
H2H / Season Series
Last 5 Games





NBA Standings
Eastern Conference — Southeast
| Team | W | L | PCT | GB | STRK |
|---|---|---|---|---|---|
 Atlanta | 4 | 1 | .800 | - | W4 |
| Orlando | 3 | 1 | .750 | 0.5 | W2 |
 Miami | 3 | 2 | .600 | 1 | L1 |
 Washington | 2 | 2 | .500 | 1.5 | L2 |
 Charlotte | 1 | 3 | .250 | 2.5 | L2 |
Western Conference — Pacific
| Team | W | L | PCT | GB | STRK |
|---|---|---|---|---|---|
 Golden State | 4 | 2 | .667 | - | W3 |
| LA Clippers | 2 | 1 | .667 | 0.5 | W1 |
 LA Lakers | 2 | 3 | .400 | 1.5 | L2 |
 Phoenix | 1 | 4 | .200 | 2.5 | L2 |
 Sacramento | 0 | 5 | .000 | 3.5 | L5 |
Rosters
Magic
10th in Eastern Conference Division
VS
Clippers
4th in Pacific Division
Forward
#22
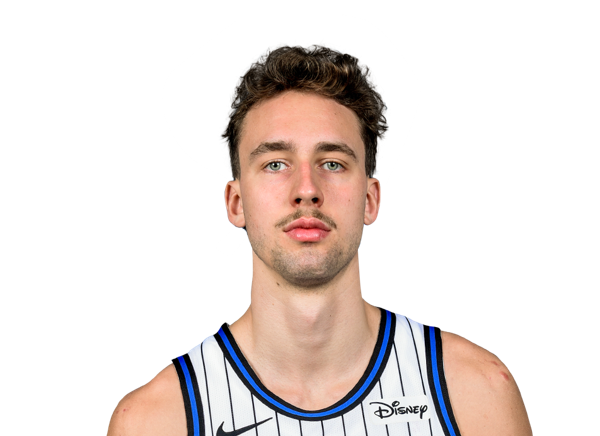
Franz Wagner
#23
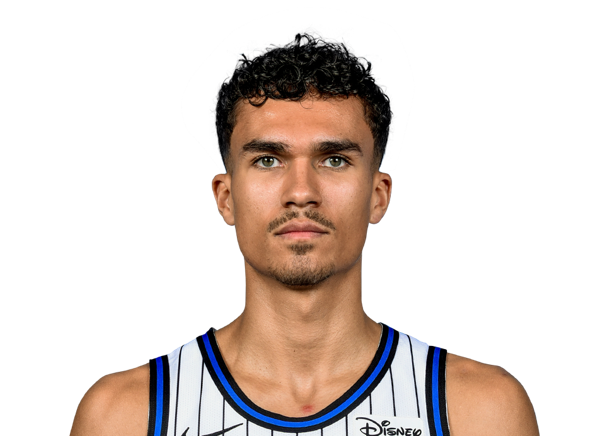
Tristan da Silva
#8

Jamal Cain
#5

Paolo Banchero
#1

Jonathan Isaac
#93
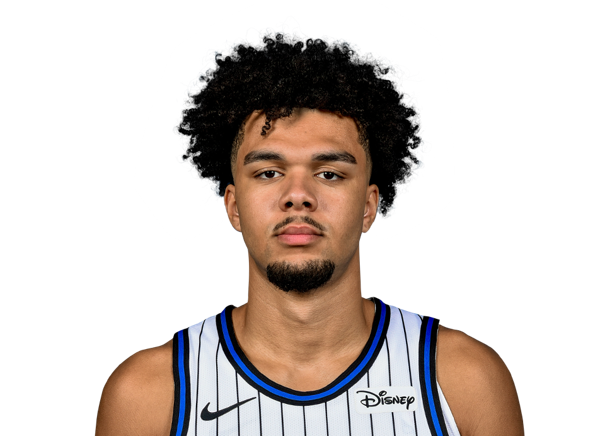
Noah Penda
#25
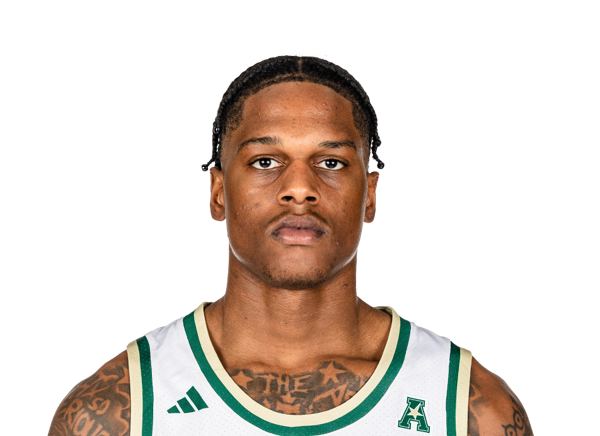
Izaiyah Nelson
Guard
#3

Desmond Bane
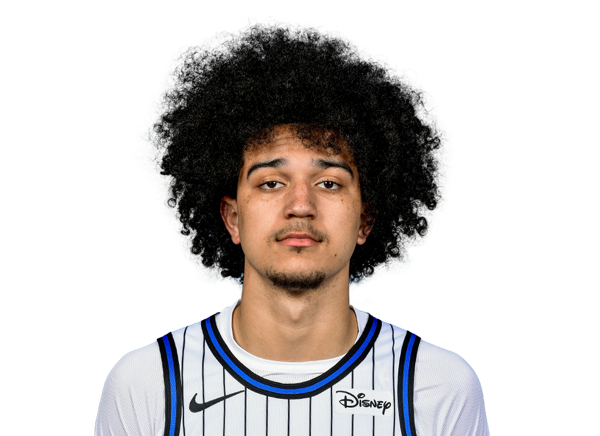
Anthony Black
#11
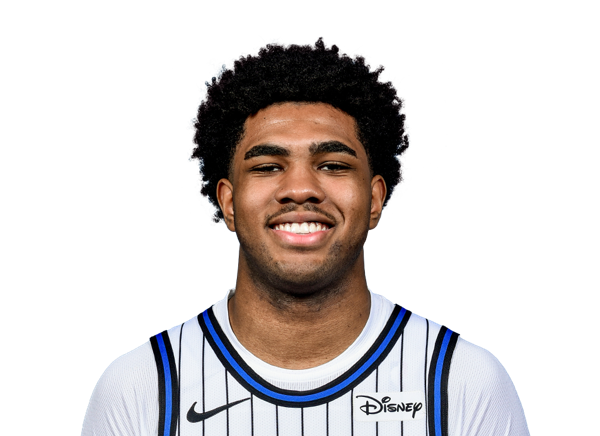
Jase Richardson
#4

Jalen Suggs
#2
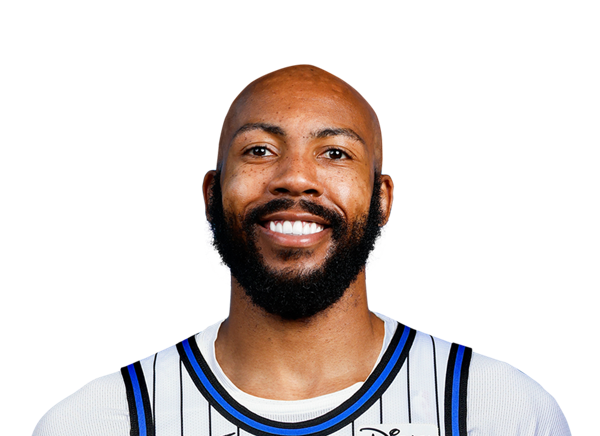
Jevon Carter
#30

Alex Morales
Center
#34
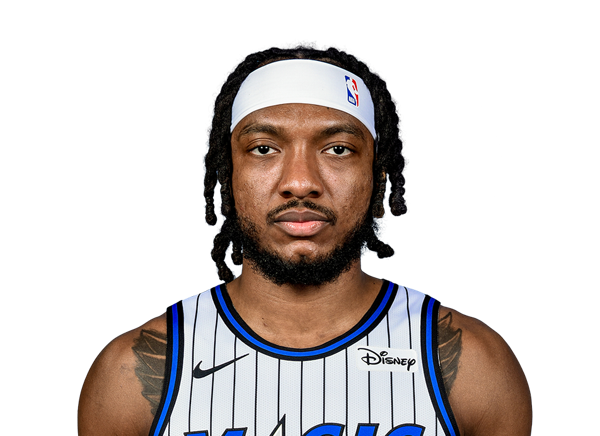
Wendell Carter Jr.
#35
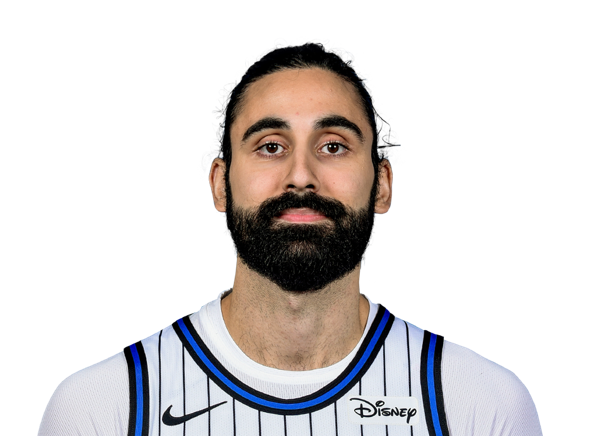
Goga Bitadze
#9
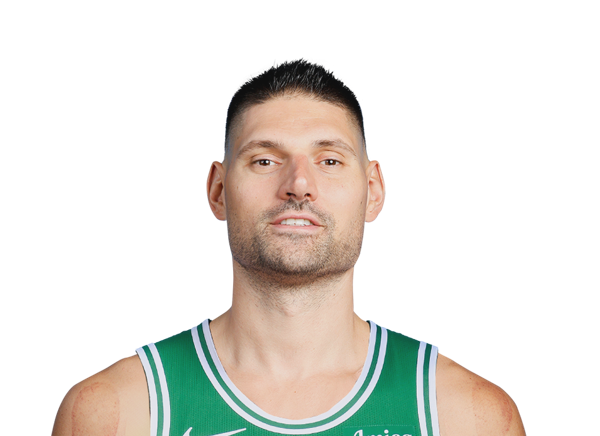
Nikola Vucevic
#14
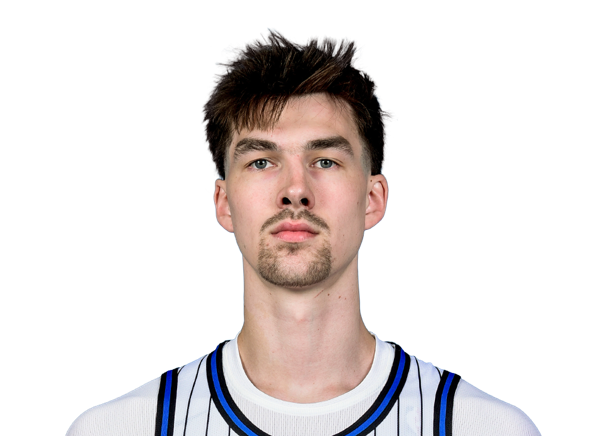
Colin Castleton
Guard
#10

Darius Garland
#1
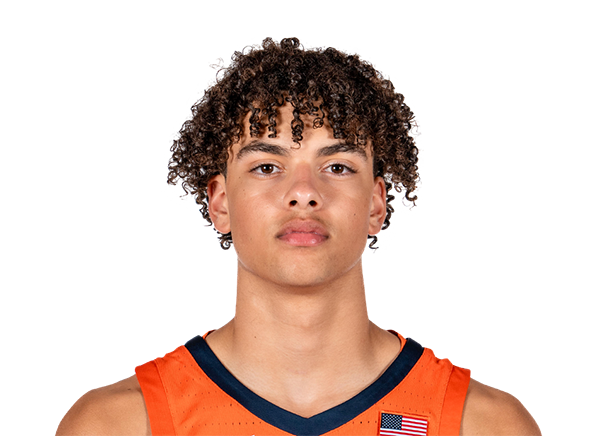
Keaton Wagler
#8

Kris Dunn
#4
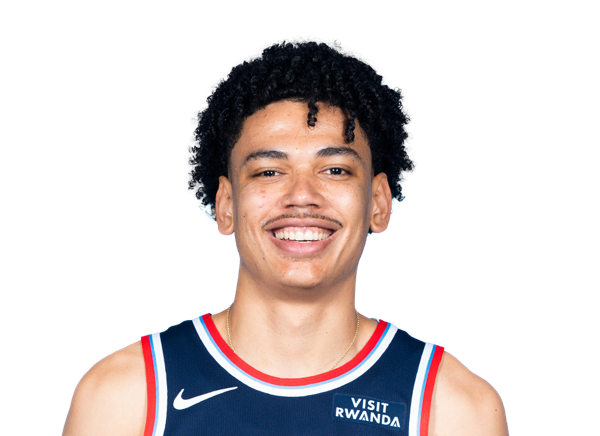
Kobe Sanders
#9
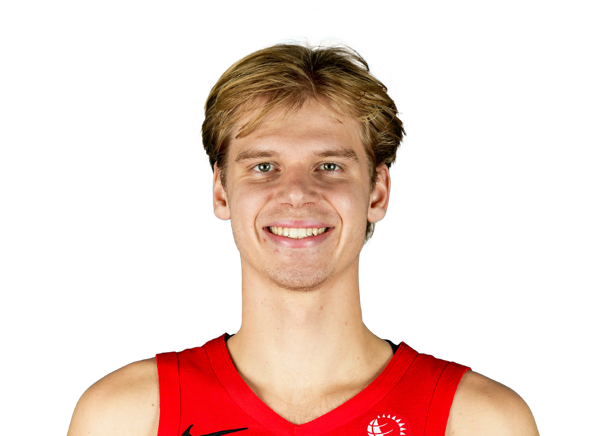
Gradey Dick
#24

Cam Christie
#21
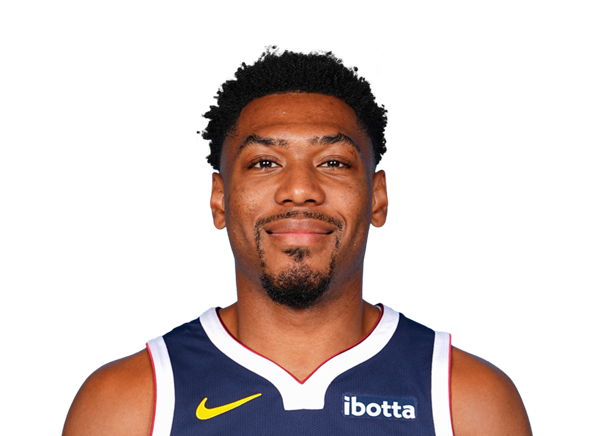
Jalen Pickett
#20

Blake Wesley
#3
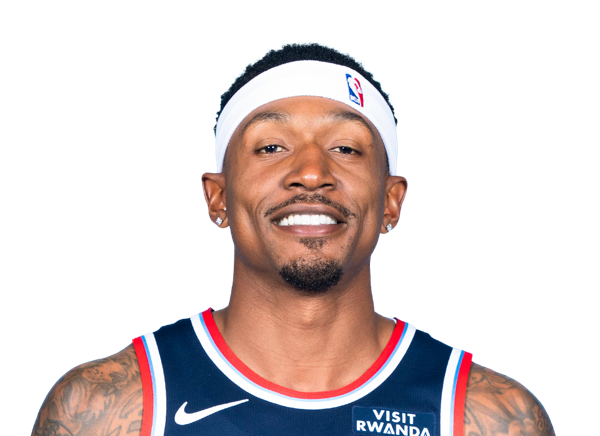
Bradley Beal
#22
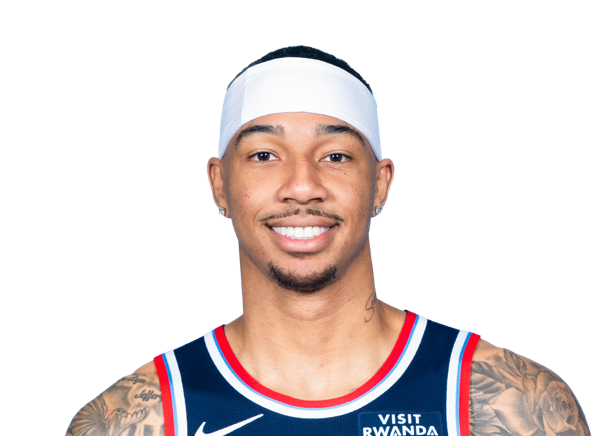
Jordan Miller
Forward
#28
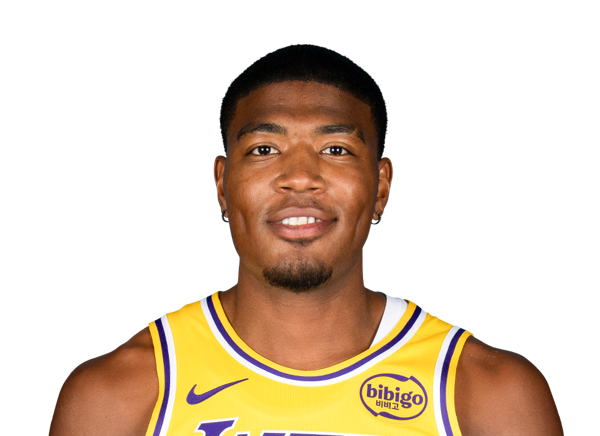
Rui Hachimura
#5
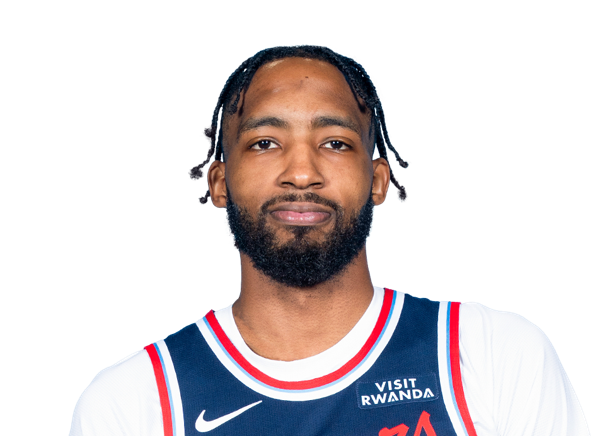
Derrick Jones Jr.
#23
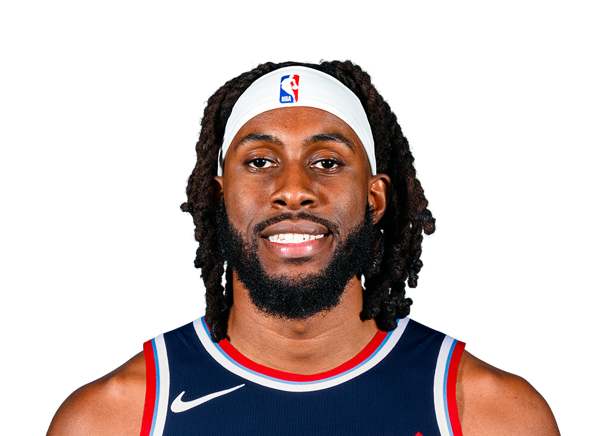
Isaiah Jackson
#12
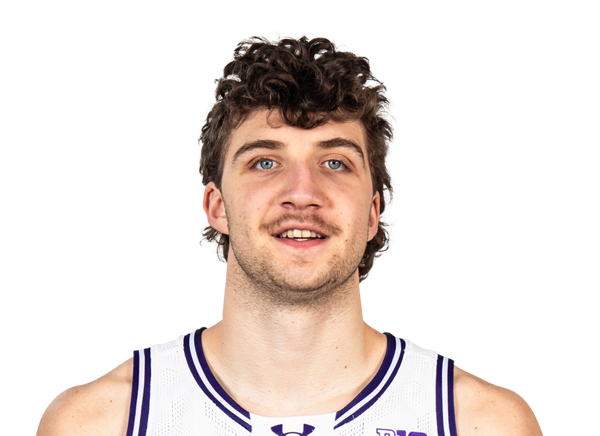
Nick Martinelli
#18
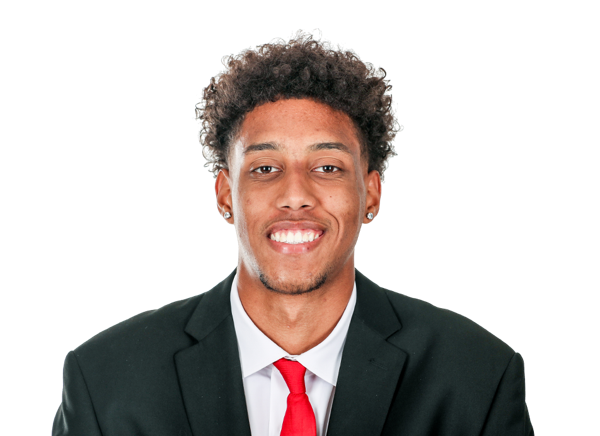
Baba Miller
#7
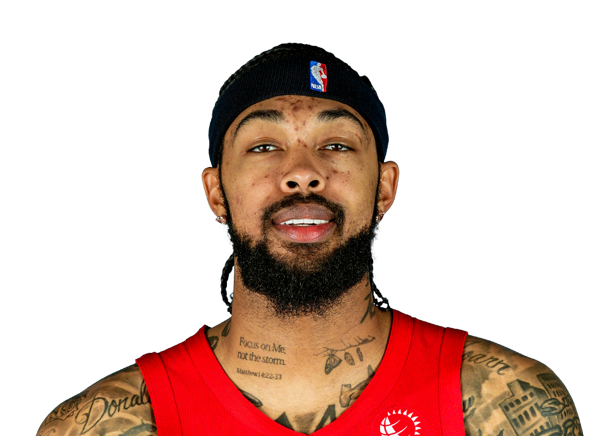
Brandon Ingram
Center
#11
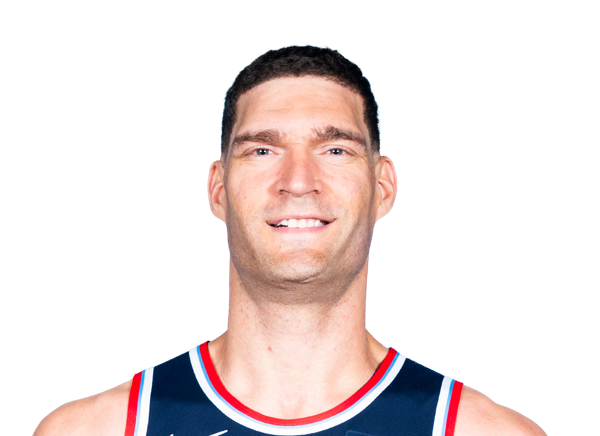
Brook Lopez
#14
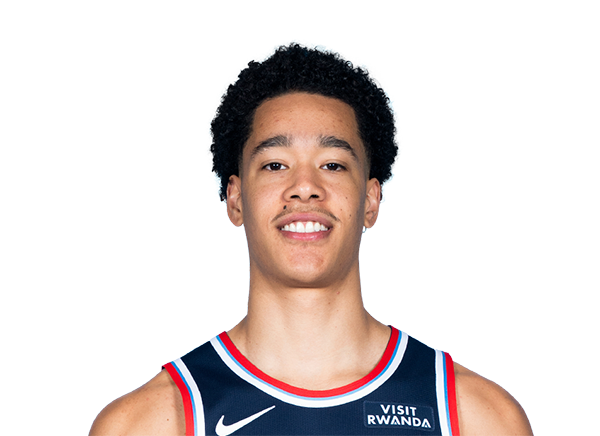
Yanic Konan Niederhauser
Team Statistics
Magic
10th in Eastern Conference Division
VS
Clippers
4th in Pacific Division
General
40.0
Rebounds Per Game
41.2
1.6
Assist To Turnover Ratio
1.2
24.5
Fouls Per Game
20.2
6
Games Played
6
0
Games Started
0
0
Minutes
0
0.0
Minutes Per Game
0.0
240
Rebounds
247
240
Rebounds
247
Offensive
77.6
Free Throw Percentage
82.0
35.4
3-Point Field Goal Percentage
38.6
37.0
Average Field Goals Made
37.0
82.0
Average Field Goals Attempted
82.7
13.5
Average 3-Point Field Goals Made
13.5
38.2
Average 3-Point Field Goals Attempted
35.0
20.2
Average Free Throws Made
19.0
26.0
Average Free Throws Attempted
23.2
107.7
Points Per Game
106.5
9.7
Offensive Rebounds Per Game
11.2
26.3
Assists Per Game
24.3
16.7
Turnovers Per Game
20.5
53.6
2-Point Field Goal Percentage
49.3
1.313
Scoring Efficiency
1.288
0.53
Shooting Efficiency
0.53
45.1
Field Goal Percentage
44.8
141.0
2-Point Field Goals Made
141.0
263.0
2-Point Field Goals Attempted
286.0
646
Points
639
58
Offensive Rebounds
67
158
Assists
146
100
Turnovers
123
222
Field Goals Made
222
492
Field Goals Attempted
496
121
Free Throws Made
114
156
Free Throws Attempted
139
81
3-Point Field Goals Made
81
229
3-Point Field Goals Attempted
210
35.4
3-Point Field Goal Percentage
38.6
23.5
2-Point Field Goals Made per Game
23.5
43.8
2-Point Field Goals Attempted per Game
47.7
Defensive
30.3
Defensive Rebounds Per Game
30.0
4.2
Blocks Per Game
4.2
7.0
Steals Per Game
11.3
182
Defensive Rebounds
180
42
Steals
68
25
Blocks
25