

Magic vs Hawks Live Score (20 Dec, 2026)
Game Information
League
NBA
Season
1
Date
December 19, 2026
Tipoff
7:00 PM EST
Status
Scheduled
Team Stats
 ORL
Game Comparison
ATL
-Points-
-Rebounds-
-Assists-
46Field Goal %45
-3-Point %-
-Free Throw %-
Game Leaders
ORLATL
 —#
Points
—
—#
—#
Rebounds
—
—#
—#
Assists
—
—#
Injury Report
H2H / Season Series
Last 5 Games









NBA Standings
Eastern Conference — Southeast
| Team | W | L | PCT | GB | STRK |
|---|---|---|---|---|---|
 Miami | 9 | 6 | .600 | - | W6 |
| Atlanta | 9 | 6 | .600 | - | W2 |
| Orlando | 6 | 8 | .429 | 2.5 | L1 |
 Washington | 5 | 11 | .313 | 4.5 | W1 |
 Charlotte | 4 | 10 | .286 | 4.5 | L3 |
Rosters
Magic
8th in Eastern Conference Division
VS
Hawks
4th in Eastern Conference Division
Forward
#22

Franz Wagner
#23
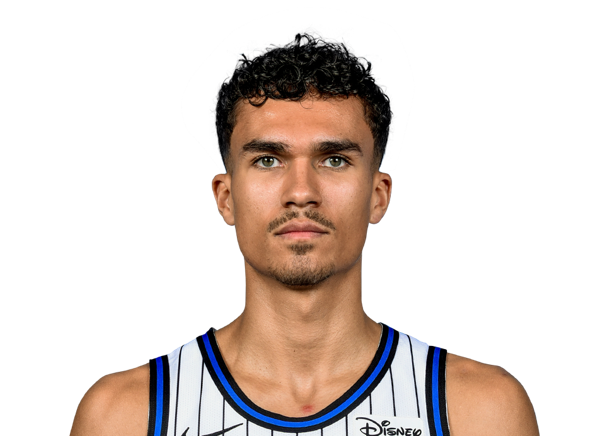
Tristan da Silva
#8

Jamal Cain
#5

Paolo Banchero
#1

Jonathan Isaac
#25

Izaiyah Nelson
#93
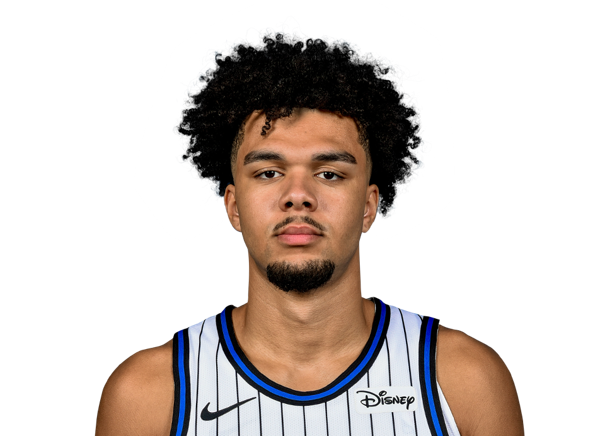
Noah Penda
Guard
#3

Desmond Bane
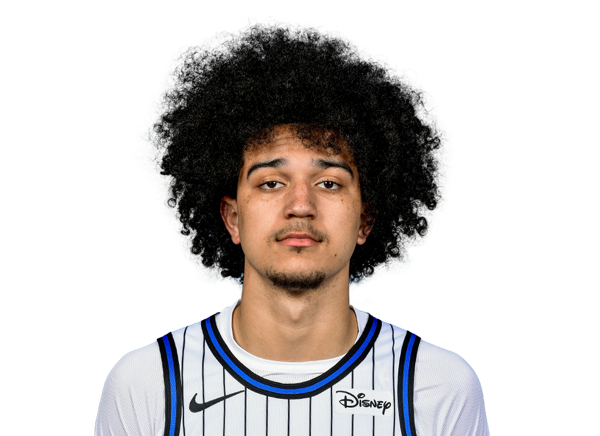
Anthony Black
#11
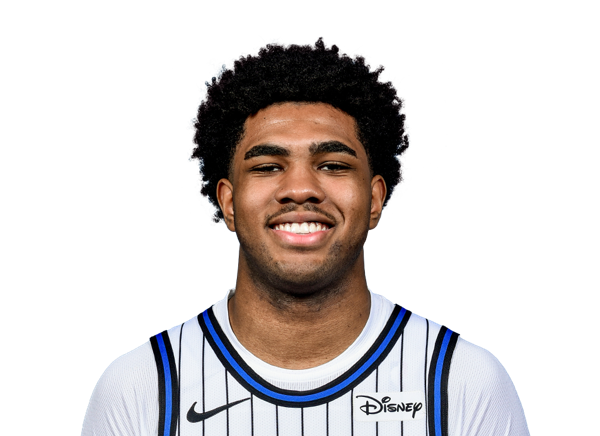
Jase Richardson
#2

Jevon Carter
#4

Jalen Suggs
#30

Alex Morales
Center
#34

Wendell Carter Jr.
#35

Goga Bitadze
#9

Nikola Vucevic
#14

Colin Castleton
Guard
#7

Nickeil Alexander-Walker
#22
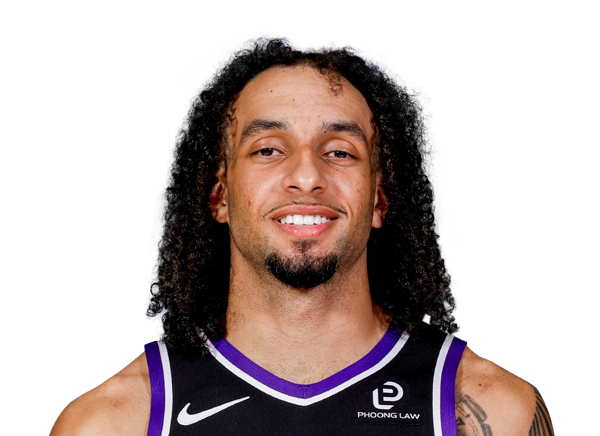
Devin Carter
#5

Dyson Daniels
#00

RayJ Dennis
#5

Luguentz Dort

Kingston Flemings

Keshon Gilbert
#8
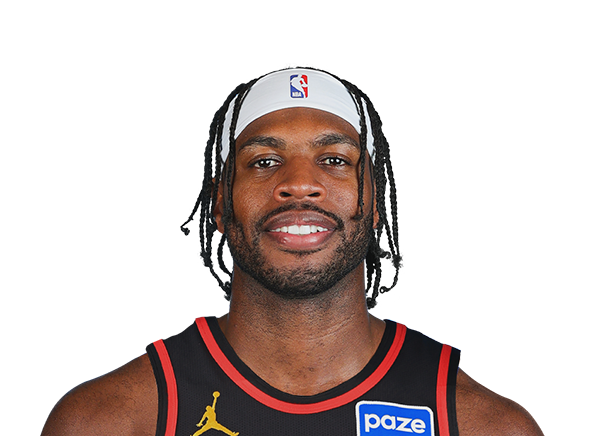
Buddy Hield
#3

CJ McCollum
#9

Ryan Nembhard
#2
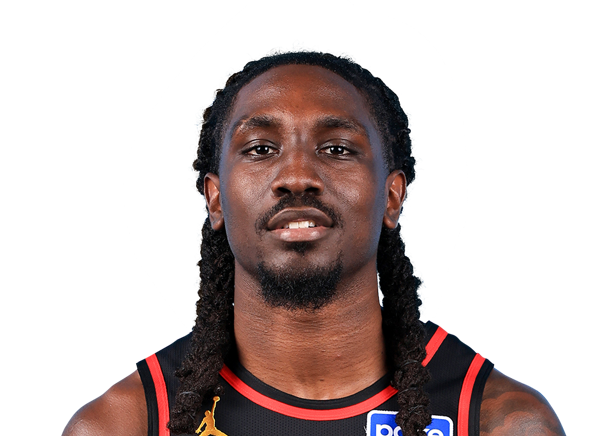
Keaton Wallace
#21
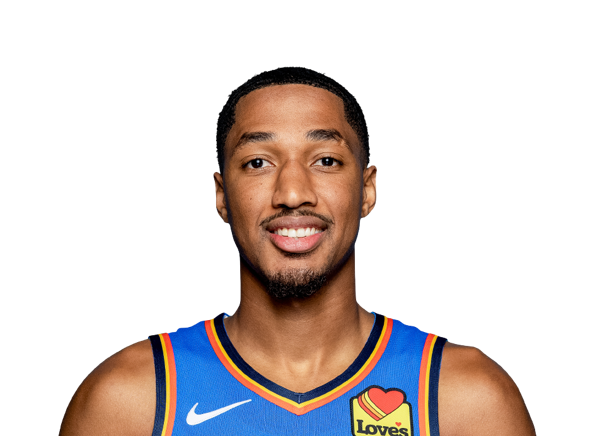
Aaron Wiggins
Forward

Zuby Ejiofor
#18

Mouhamed Gueye
#1
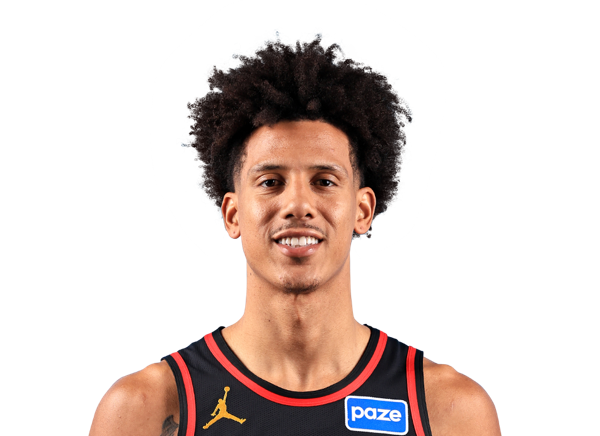
Jalen Johnson
#24

Corey Kispert
#14

Asa Newell
#17

Onyeka Okongwu
#22
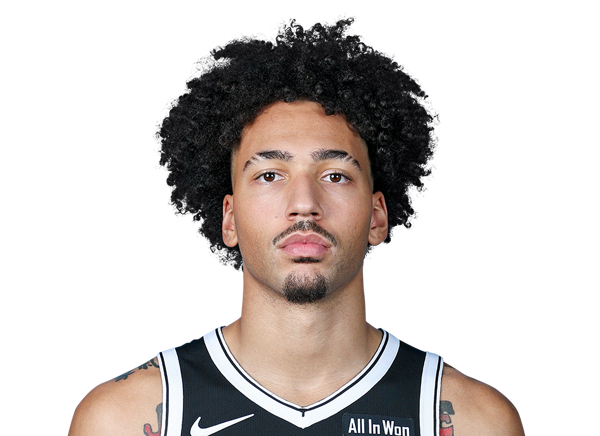
Jalen Wilson
Center
#35

Christian Koloko
#31

Jock Landale

Henri Veesaar
Team Statistics
Magic
8th in Eastern Conference Division
VS
Hawks
4th in Eastern Conference Division
General
42.6
Rebounds Per Game
44.7
1.7
Assist To Turnover Ratio
2.1
22.5
Fouls Per Game
21.6
15
Games Played
16
0
Games Started
0
0
Minutes
0
0.0
Minutes Per Game
0.0
639
Rebounds
715
639
Rebounds
715
Offensive
76.5
Free Throw Percentage
76.1
35.8
3-Point Field Goal Percentage
34.5
39.0
Average Field Goals Made
43.5
85.1
Average Field Goals Attempted
95.8
14.5
Average 3-Point Field Goals Made
14.8
40.5
Average 3-Point Field Goals Attempted
42.9
17.1
Average Free Throws Made
15.5
22.4
Average Free Throws Attempted
20.4
109.6
Points Per Game
117.3
10.9
Offensive Rebounds Per Game
13.4
26.5
Assists Per Game
30.8
15.5
Turnovers Per Game
14.8
54.9
2-Point Field Goal Percentage
54.2
1.287
Scoring Efficiency
1.224
0.54
Shooting Efficiency
0.53
45.8
Field Goal Percentage
45.4
368.0
2-Point Field Goals Made
459.0
670.0
2-Point Field Goals Attempted
847.0
1644
Points
1877
163
Offensive Rebounds
215
398
Assists
492
232
Turnovers
236
585
Field Goals Made
696
1277
Field Goals Attempted
1533
257
Free Throws Made
248
336
Free Throws Attempted
326
217
3-Point Field Goals Made
237
607
3-Point Field Goals Attempted
686
35.7
3-Point Field Goal Percentage
34.5
24.5
2-Point Field Goals Made per Game
28.7
44.7
2-Point Field Goals Attempted per Game
52.9
Defensive
31.7
Defensive Rebounds Per Game
31.3
4.3
Blocks Per Game
3.8
7.6
Steals Per Game
10.4
476
Defensive Rebounds
500
114
Steals
166
65
Blocks
61