

Magic vs Nets Live Score (19 Dec, 2026)
Game Information
League
NBA
Season
1
Date
December 18, 2026
Tipoff
7:30 PM EST
Status
Scheduled
Team Stats
 ORL
Game Comparison
BKN
-Points-
-Rebounds-
-Assists-
46Field Goal %45
-3-Point %-
-Free Throw %-
Game Leaders
ORLBKN
 —#
Points
—
—#
—#
Rebounds
—
—#
—#
Assists
—
—#
Injury Report
Brooklyn Nets
H2H / Season Series
Last 5 Games






NBA Standings
Eastern Conference — Southeast
| Team | W | L | PCT | GB | STRK |
|---|---|---|---|---|---|
 Miami | 9 | 6 | .600 | - | W6 |
 Atlanta | 9 | 6 | .600 | - | W2 |
| Orlando | 6 | 8 | .429 | 2.5 | L1 |
 Washington | 5 | 11 | .313 | 4.5 | W1 |
 Charlotte | 4 | 10 | .286 | 4.5 | L3 |
Eastern Conference — Atlantic
| Team | W | L | PCT | GB | STRK |
|---|---|---|---|---|---|
 Philadelphia | 13 | 3 | .813 | - | W4 |
 Boston | 11 | 4 | .733 | 1.5 | L2 |
 New York | 9 | 6 | .600 | 3.5 | W3 |
 Toronto | 5 | 10 | .333 | 7.5 | L6 |
| Brooklyn | 3 | 11 | .214 | 9 | L3 |
Rosters
Magic
8th in Eastern Conference Division
VS
Nets
5th in Atlantic Division
Forward
#22

Franz Wagner
#23
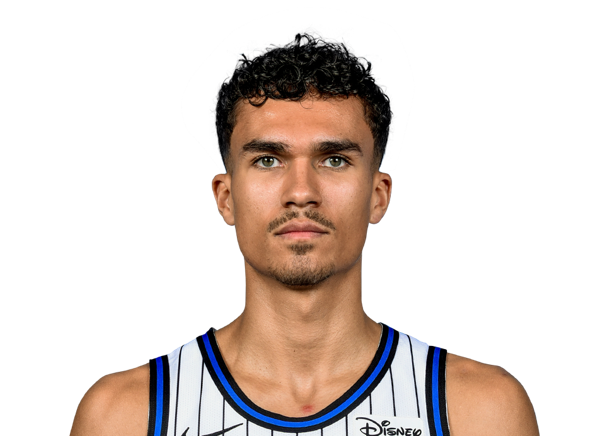
Tristan da Silva
#8

Jamal Cain
#5

Paolo Banchero
#1

Jonathan Isaac
#25
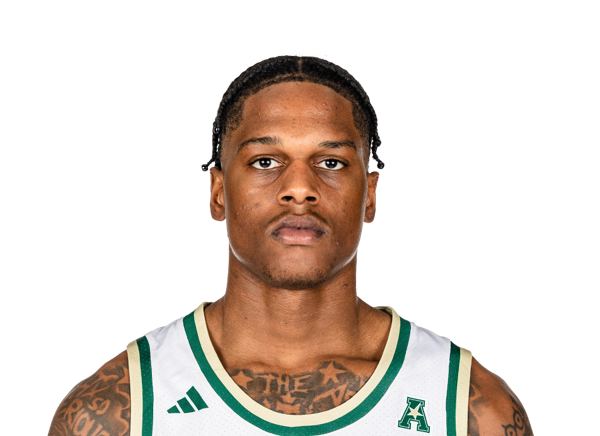
Izaiyah Nelson
#93
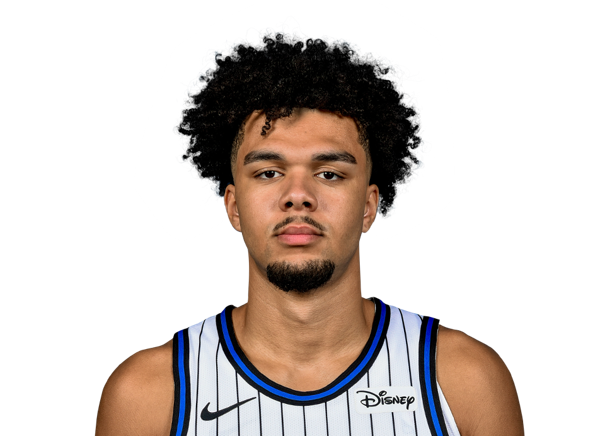
Noah Penda
Guard
#3

Desmond Bane
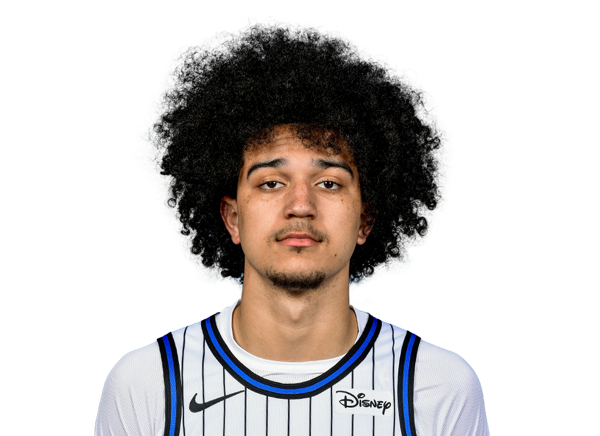
Anthony Black
#11
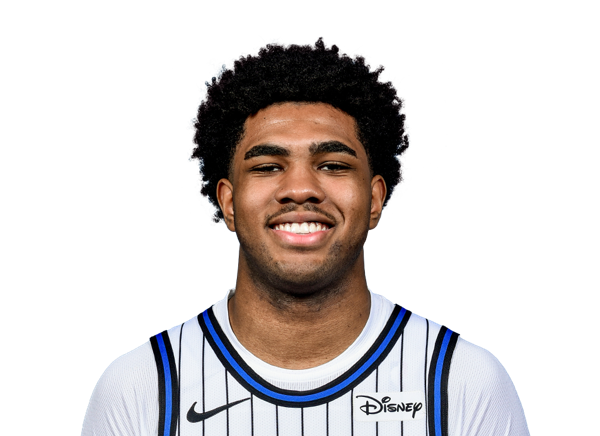
Jase Richardson
#2

Jevon Carter
#4

Jalen Suggs
#30

Alex Morales
Center
#34
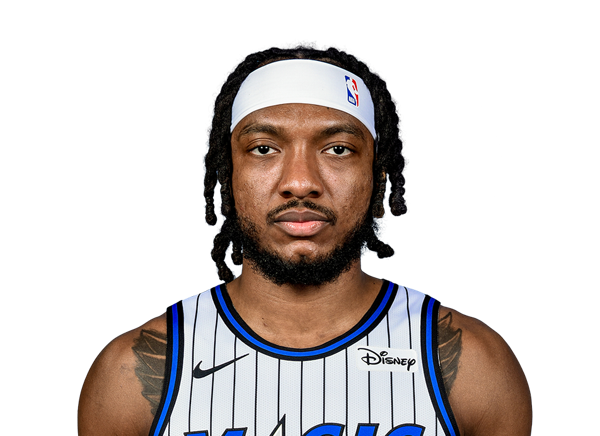
Wendell Carter Jr.
#35

Goga Bitadze
#9

Nikola Vucevic
#14

Colin Castleton
Forward
#30
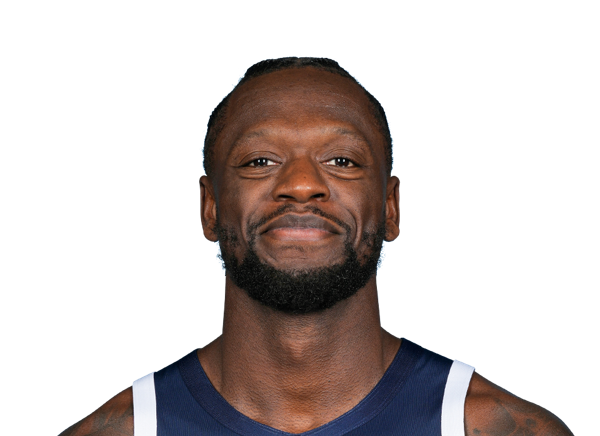
Julius Randle
#17
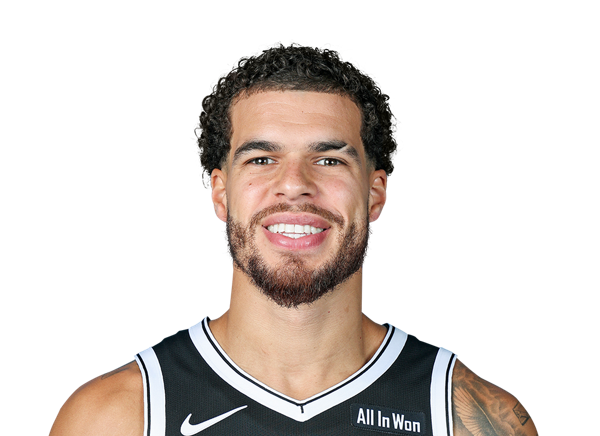
Michael Porter Jr.
#2
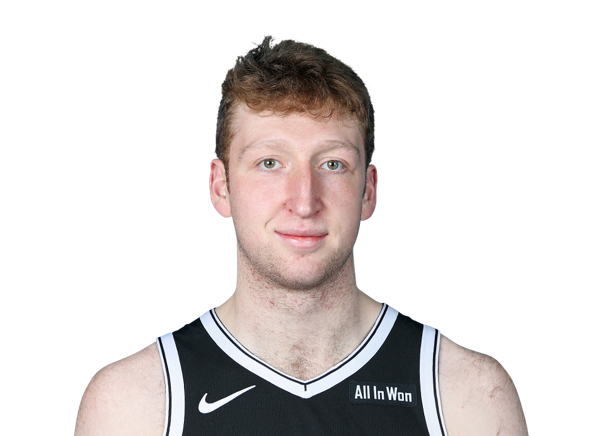
Danny Wolf
#21
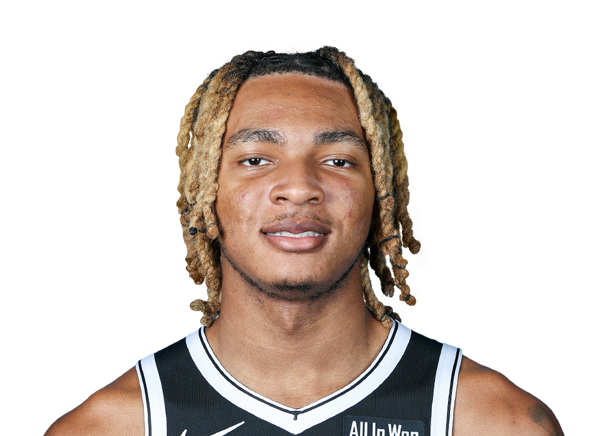
Noah Clowney
#31

Chaney Johnson
#00

Josh Minott
#9

Joshua Jefferson
#16

Grant Nelson
Guard
#10

Nolan Traore
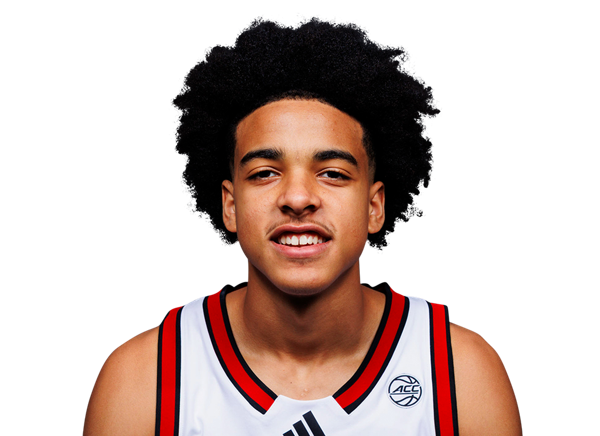
Mikel Brown Jr.
#8

Egor Demin
#1

Keon Ellis
#4

Drake Powell
#77

Ben Saraf
#14

Terance Mann
Center
#13
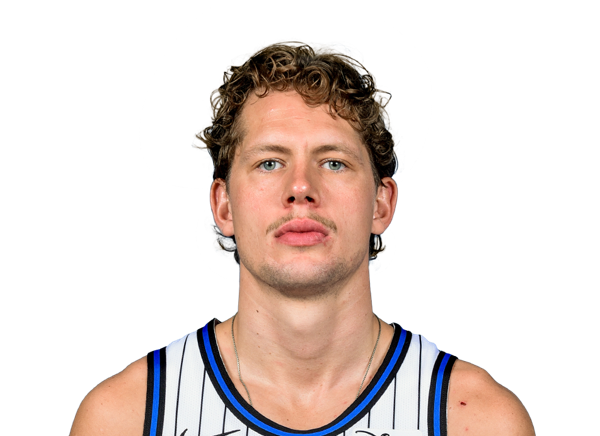
Moritz Wagner
#20
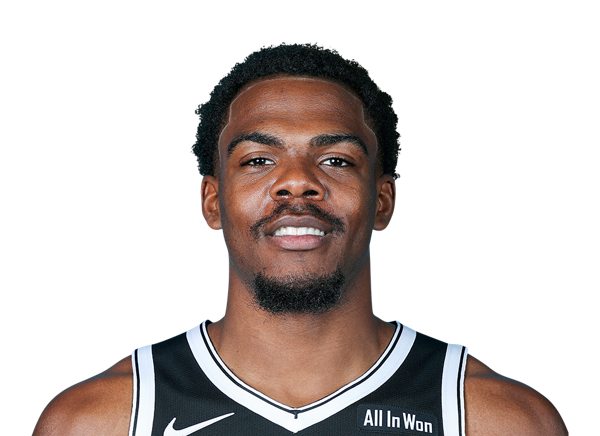
Day'Ron Sharpe
Team Statistics
Magic
8th in Eastern Conference Division
VS
Nets
5th in Atlantic Division
General
42.6
Rebounds Per Game
41.3
1.7
Assist To Turnover Ratio
1.5
22.5
Fouls Per Game
25.5
15
Games Played
15
0
Games Started
0
0
Minutes
0
0.0
Minutes Per Game
0.0
639
Rebounds
619
639
Rebounds
619
Offensive
76.5
Free Throw Percentage
75.4
35.8
3-Point Field Goal Percentage
36.0
39.0
Average Field Goals Made
37.7
85.1
Average Field Goals Attempted
84.1
14.5
Average 3-Point Field Goals Made
14.3
40.5
Average 3-Point Field Goals Attempted
39.9
17.1
Average Free Throws Made
21.1
22.4
Average Free Throws Attempted
27.9
109.6
Points Per Game
110.9
10.9
Offensive Rebounds Per Game
11.5
26.5
Assists Per Game
24.3
15.5
Turnovers Per Game
16.5
54.9
2-Point Field Goal Percentage
52.9
1.287
Scoring Efficiency
1.318
0.54
Shooting Efficiency
0.53
45.8
Field Goal Percentage
44.8
368.0
2-Point Field Goals Made
351.0
670.0
2-Point Field Goals Attempted
664.0
1644
Points
1663
163
Offensive Rebounds
172
398
Assists
365
232
Turnovers
247
585
Field Goals Made
566
1277
Field Goals Attempted
1262
257
Free Throws Made
316
336
Free Throws Attempted
419
217
3-Point Field Goals Made
215
607
3-Point Field Goals Attempted
598
35.7
3-Point Field Goal Percentage
36.0
24.5
2-Point Field Goals Made per Game
23.4
44.7
2-Point Field Goals Attempted per Game
44.3
Defensive
31.7
Defensive Rebounds Per Game
29.8
4.3
Blocks Per Game
4.7
7.6
Steals Per Game
8.4
476
Defensive Rebounds
447
114
Steals
126
65
Blocks
71