

Magic vs Nuggets Live Score (18 Jan, 2027)
Game Information
League
NBA
Season
1
Date
January 17, 2027
Tipoff
8:00 PM EST
Status
Scheduled
Team Stats
 ORL
Game Comparison
DEN

-Points-
-Rebounds-
-Assists-
-Field Goal %-
-3-Point %-
-Free Throw %-
Injury Report
Orlando Magic
H2H / Season Series
Last 5 Games






NBA Standings
Eastern Conference — Southeast
| Team | W | L | PCT | GB | STRK |
|---|---|---|---|---|---|
 Atlanta | 4 | 1 | .800 | - | W4 |
| Orlando | 3 | 1 | .750 | 0.5 | W2 |
 Miami | 3 | 2 | .600 | 1 | L1 |
 Washington | 2 | 2 | .500 | 1.5 | L2 |
 Charlotte | 1 | 3 | .250 | 2.5 | L2 |
Western Conference — Northwest
| Team | W | L | PCT | GB | STRK |
|---|---|---|---|---|---|
 Utah | 3 | 1 | .750 | - | W2 |
 Portland | 3 | 1 | .750 | - | L1 |
| Denver | 3 | 2 | .600 | 0.5 | W1 |
 Minnesota | 3 | 3 | .500 | 1 | L2 |
 Oklahoma City | 1 | 4 | .200 | 2.5 | L1 |
Rosters
Magic
10th in Eastern Conference Division
VS
Nuggets
10th in Western Conference Division
Forward
#22

Franz Wagner
#23
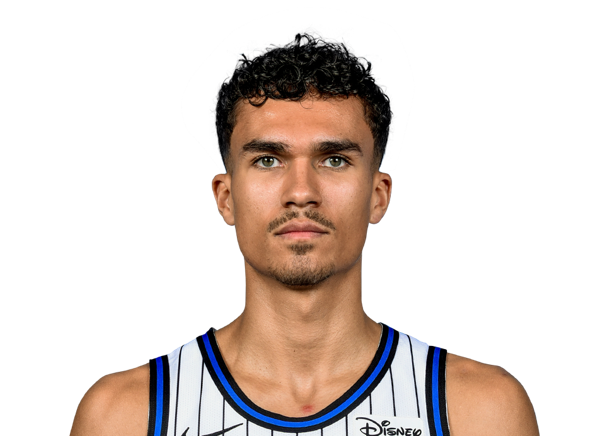
Tristan da Silva
#8

Jamal Cain
#5

Paolo Banchero
#1

Jonathan Isaac
#93
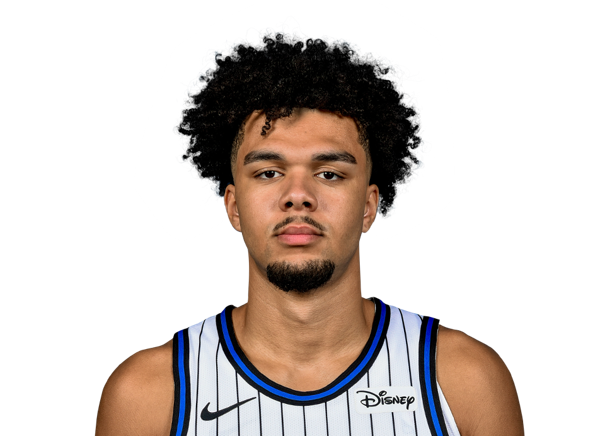
Noah Penda
#25

Izaiyah Nelson
Guard
#3

Desmond Bane
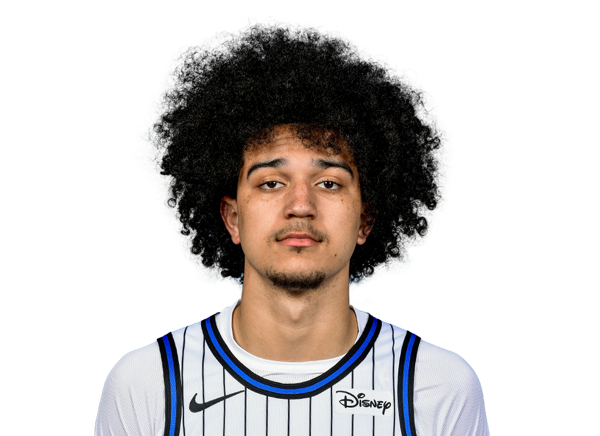
Anthony Black
#11
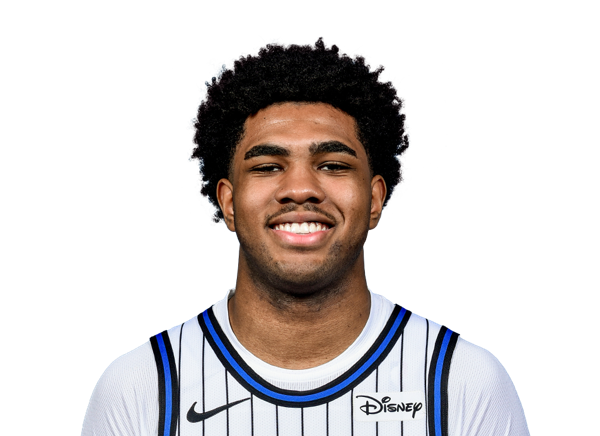
Jase Richardson
#4

Jalen Suggs
#2
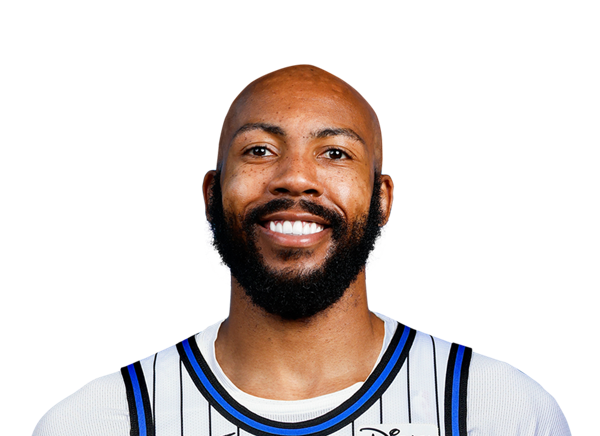
Jevon Carter
#30

Alex Morales
Center
#34
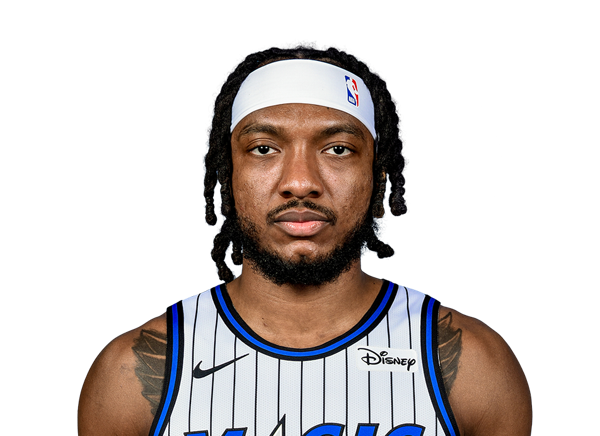
Wendell Carter Jr.
#35

Goga Bitadze
#9

Nikola Vucevic
#14

Colin Castleton
Guard
#27
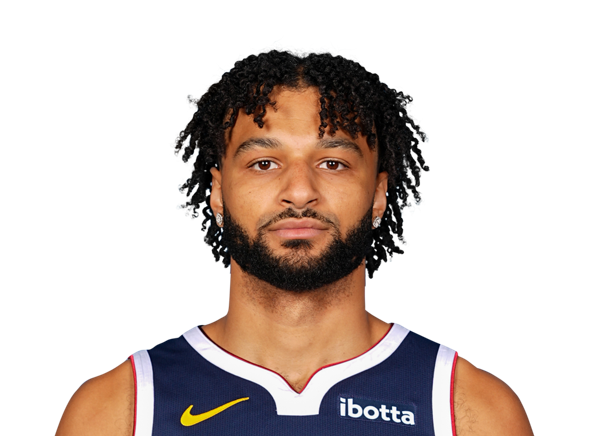
Jamal Murray

Christian Braun
#10
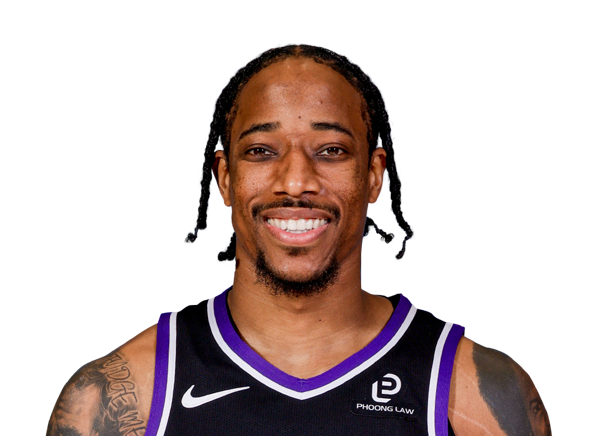
DeMar DeRozan
#5
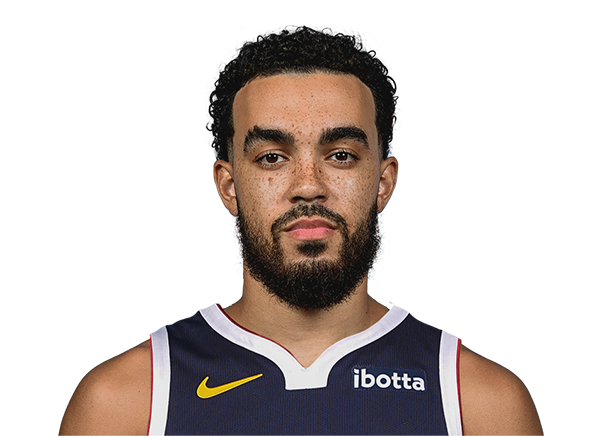
Tyus Jones
#9

Ryan Nembhard
#1
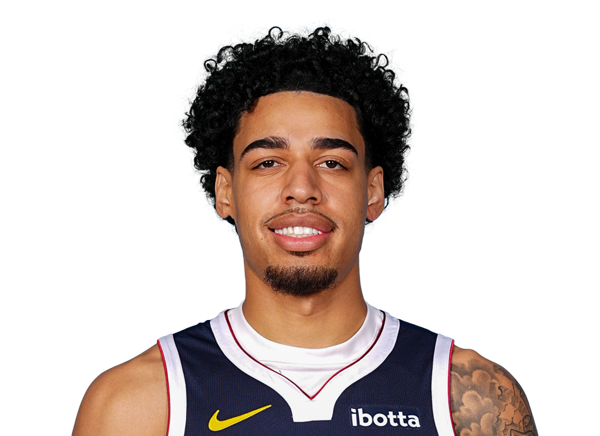
Julian Strawther
Center
#15

Nikola Jokic
Forward
#32

Aaron Gordon
#7
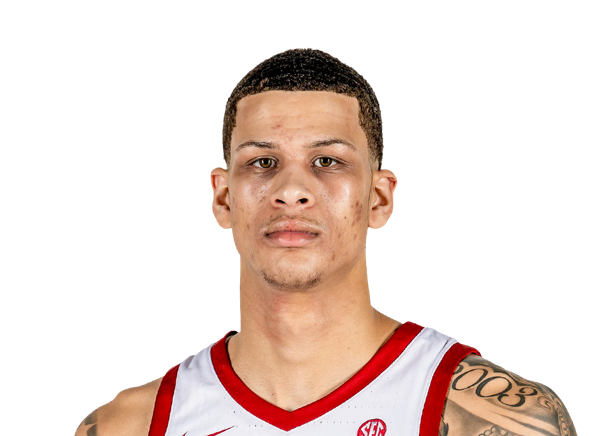
Trevon Brazile
#3

Marvin Bagley III
#13

Bryce Hopkins
#23
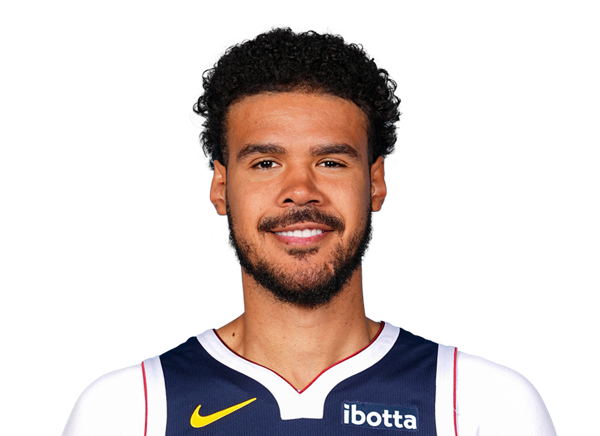
Cameron Johnson
#22

Zeke Nnaji
#11
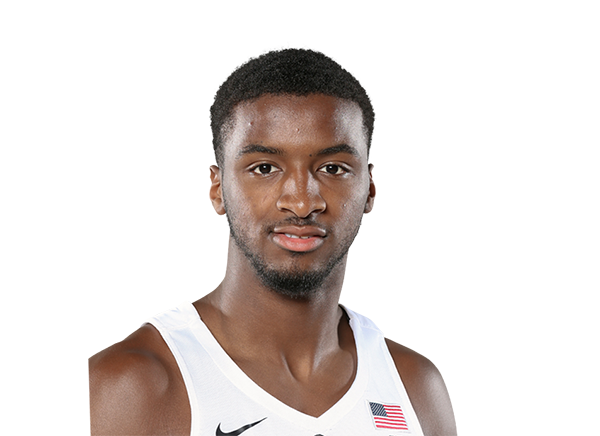
Alpha Diallo
#00
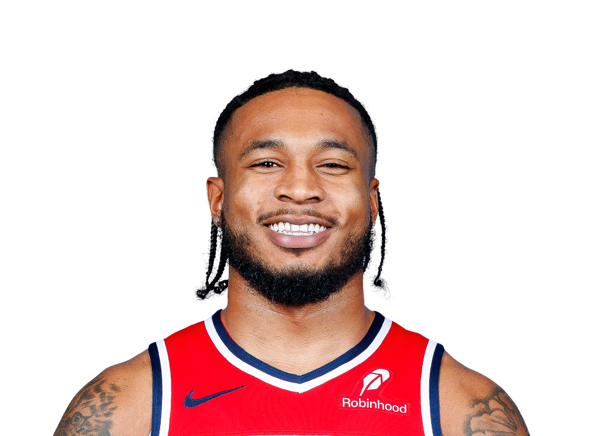
Cam Whitmore
#14

DaRon Holmes II
#21
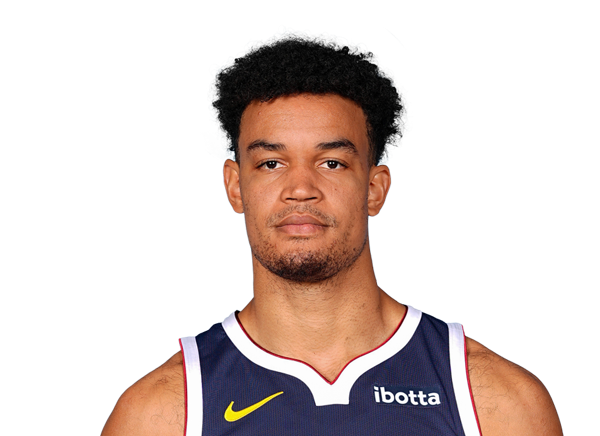
Spencer Jones
Team Statistics
Magic
10th in Eastern Conference Division
VS
Nuggets
10th in Western Conference Division
General
40.0
Rebounds Per Game
43.6
1.6
Assist To Turnover Ratio
1.7
24.5
Fouls Per Game
20.0
6
Games Played
5
0
Games Started
0
0
Minutes
0
0.0
Minutes Per Game
0.0
240
Rebounds
218
240
Rebounds
218
Offensive
77.6
Free Throw Percentage
78.9
35.4
3-Point Field Goal Percentage
37.4
37.0
Average Field Goals Made
40.0
82.0
Average Field Goals Attempted
85.0
13.5
Average 3-Point Field Goals Made
13.0
38.2
Average 3-Point Field Goals Attempted
34.8
20.2
Average Free Throws Made
21.0
26.0
Average Free Throws Attempted
26.6
107.7
Points Per Game
114.0
9.7
Offensive Rebounds Per Game
12.0
26.3
Assists Per Game
26.8
16.7
Turnovers Per Game
15.8
53.6
2-Point Field Goal Percentage
53.8
1.313
Scoring Efficiency
1.341
0.53
Shooting Efficiency
0.55
45.1
Field Goal Percentage
47.1
141.0
2-Point Field Goals Made
135.0
263.0
2-Point Field Goals Attempted
251.0
646
Points
570
58
Offensive Rebounds
60
158
Assists
134
100
Turnovers
79
222
Field Goals Made
200
492
Field Goals Attempted
425
121
Free Throws Made
105
156
Free Throws Attempted
133
81
3-Point Field Goals Made
65
229
3-Point Field Goals Attempted
174
35.4
3-Point Field Goal Percentage
37.4
23.5
2-Point Field Goals Made per Game
27.0
43.8
2-Point Field Goals Attempted per Game
50.2
Defensive
30.3
Defensive Rebounds Per Game
31.6
4.2
Blocks Per Game
4.4
7.0
Steals Per Game
10.2
182
Defensive Rebounds
158
42
Steals
51
25
Blocks
22