

Magic vs Suns Live Score (6 Nov, 2026)
Game Information
League
NBA
Season
2027
Date
November 5, 2026
Tipoff
9:00 PM EST
Status
Scheduled
ORL Record
2-5
PHX Record
1-5
Venue
Mortgage Matchup Center
Location
Phoenix, AZ
Arena Type
Indoor
Broadcast
Suns Live
Team Stats
 ORL
Game Comparison
PHX

-Points-
-Rebounds-
-Assists-
45Field Goal %46
-3-Point %-
-Free Throw %-
Game Leaders
ORLPHX
 —#
Points
—
—#
—#Rebounds
—
—#
—#Assists
—
—#
Injury Report
H2H / Season Series
Last 5 Games






NBA Standings
Eastern Conference — Southeast
| Team | W | L | PCT | GB | STRK |
|---|---|---|---|---|---|
 Atlanta | 5 | 4 | .556 | - | W2 |
 Washington | 4 | 4 | .500 | 0.5 | L1 |
 Miami | 3 | 5 | .375 | 1.5 | W1 |
 Charlotte | 3 | 6 | .333 | 2 | L5 |
| Orlando | 2 | 5 | .286 | 2 | L2 |
Western Conference — Pacific
| Team | W | L | PCT | GB | STRK |
|---|---|---|---|---|---|
 LA Lakers | 7 | 2 | .778 | - | W3 |
 Golden State | 5 | 3 | .625 | 1.5 | W5 |
| Phoenix | 1 | 5 | .167 | 4.5 | L4 |
 LA Clippers | 1 | 7 | .125 | 5.5 | L7 |
 Sacramento | 1 | 7 | .125 | 5.5 | L1 |
Rosters
Magic
10th in Eastern Conference Division
VS
Suns
3rd in Pacific Division
Forward
#22

Franz Wagner
#23
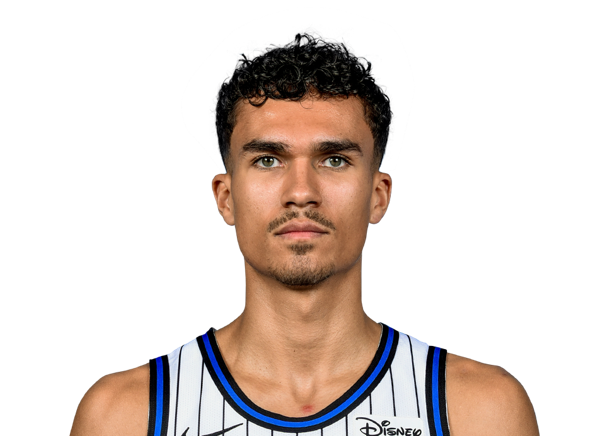
Tristan da Silva
#8

Jamal Cain
#5

Paolo Banchero
#1

Jonathan Isaac
#93
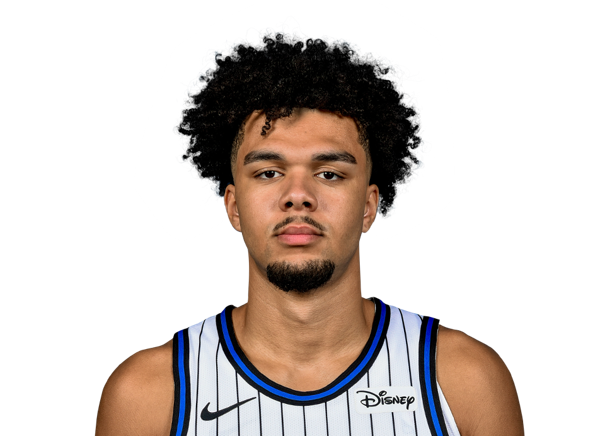
Noah Penda
#25
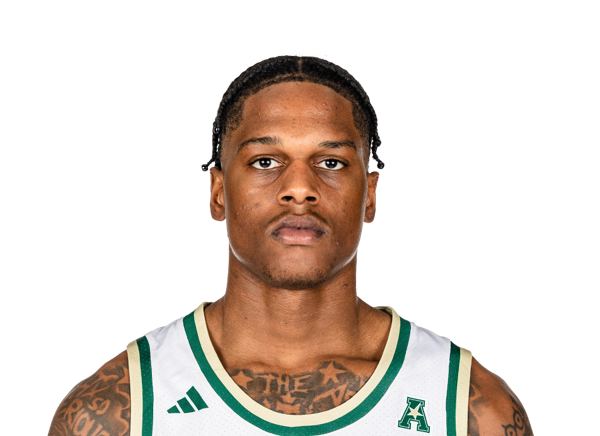
Izaiyah Nelson
Guard
#3

Desmond Bane
#11
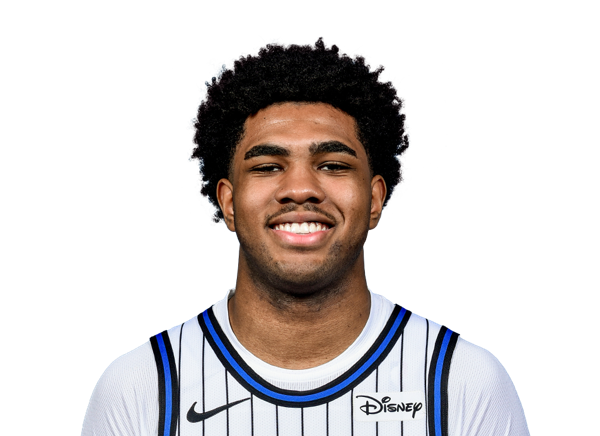
Jase Richardson
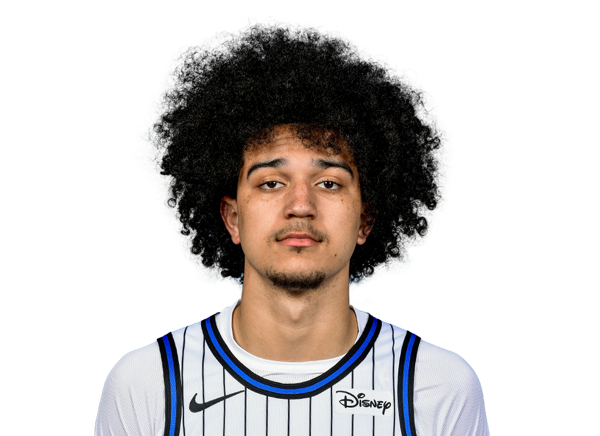
Anthony Black
#4

Jalen Suggs
#2
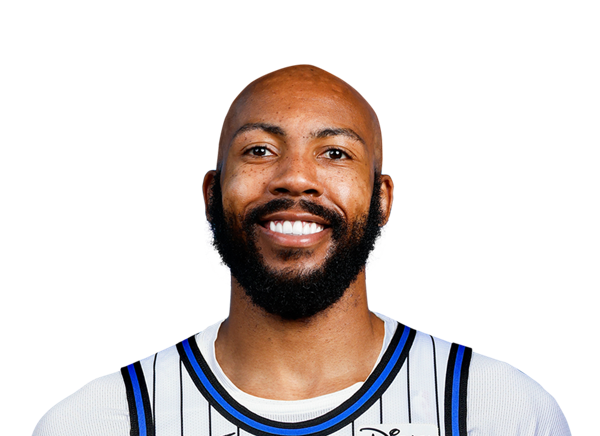
Jevon Carter
#30

Alex Morales
Center
#34
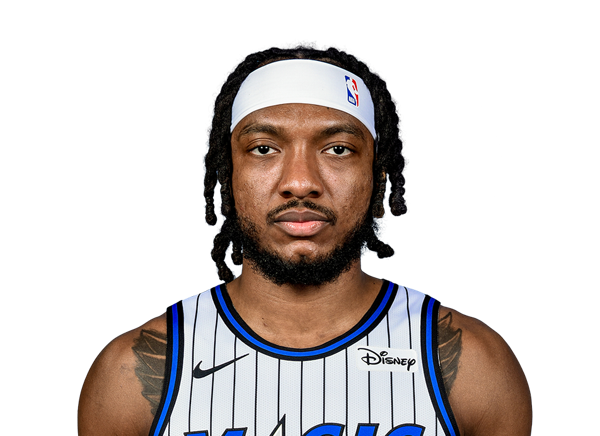
Wendell Carter Jr.
#35

Goga Bitadze
#9

Nikola Vucevic
#14

Colin Castleton
Guard
#15
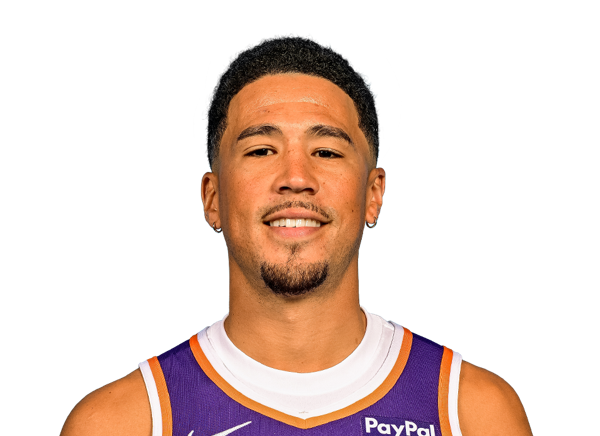
Devin Booker
#4
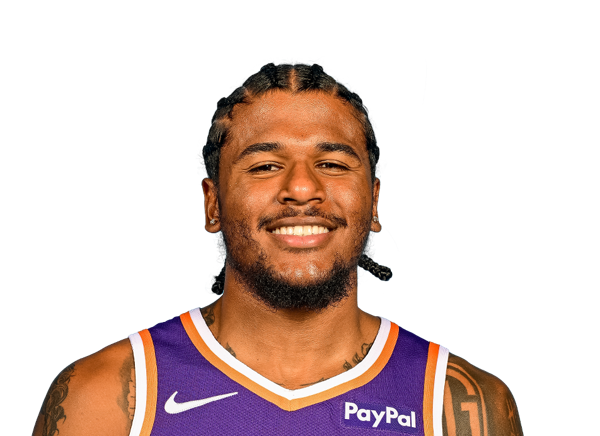
Jalen Green
#23
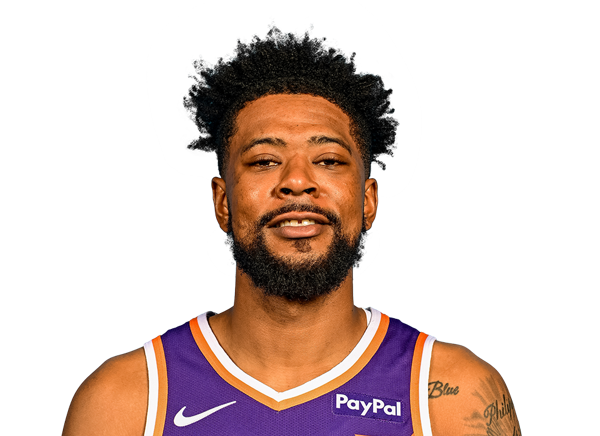
Jordan Goodwin
#8
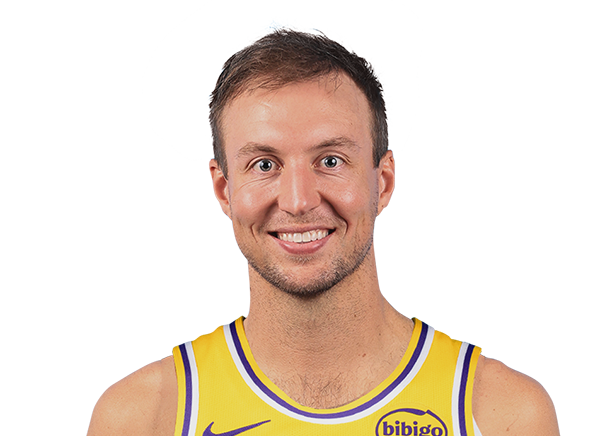
Luke Kennard
#12
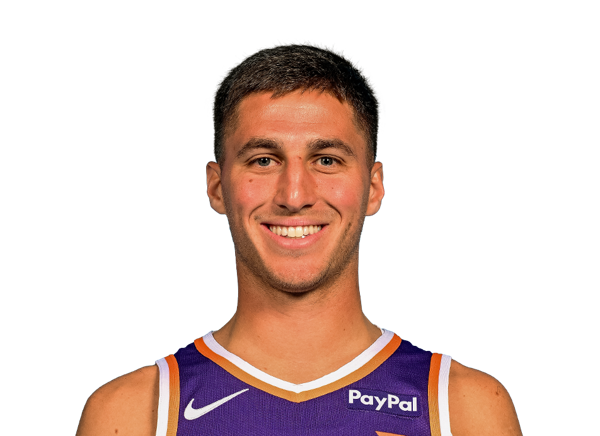
Collin Gillespie
#17
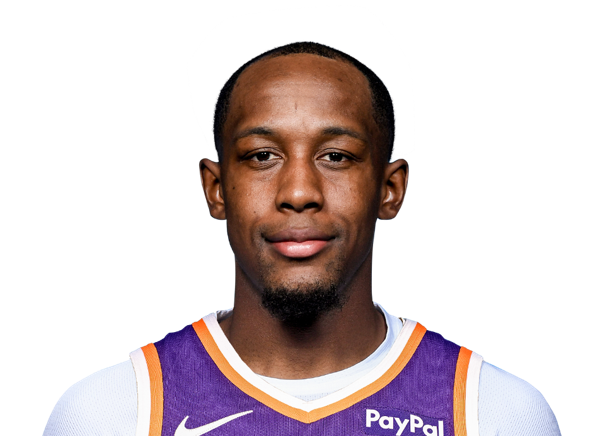
Jamaree Bouyea
#61
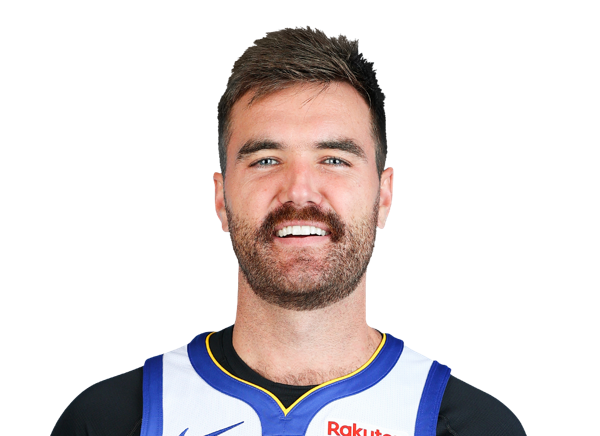
Pat Spencer
Forward
#22
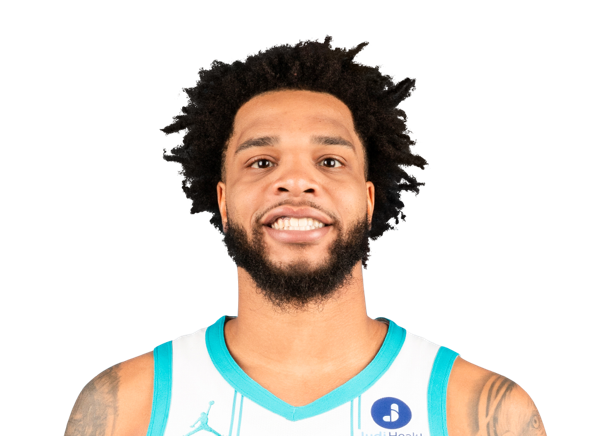
Miles Bridges
#3
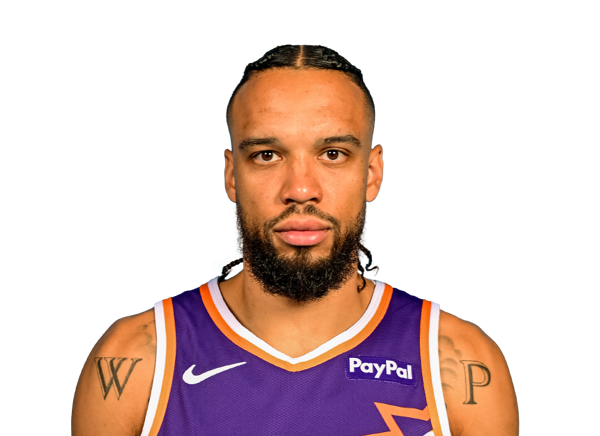
Dillon Brooks
#11
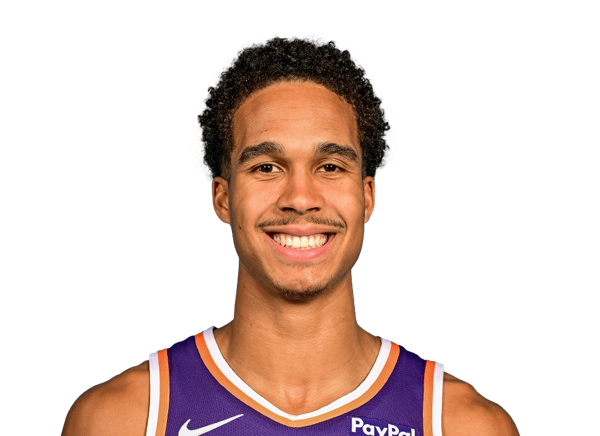
Oso Ighodaro

Ryan Dunn
#18

Koa Peat
#20

Rasheer Fleming
Center
#10
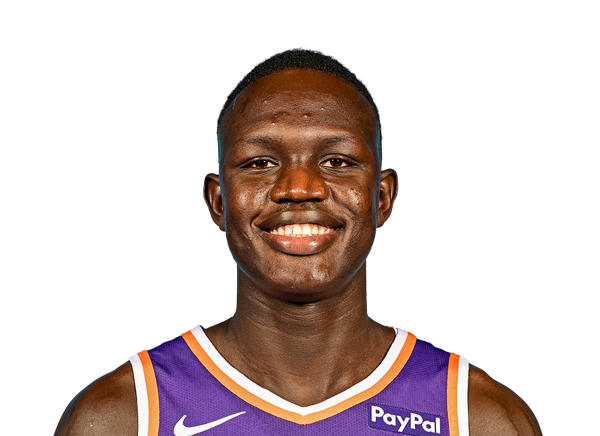
Khaman Maluach
#26
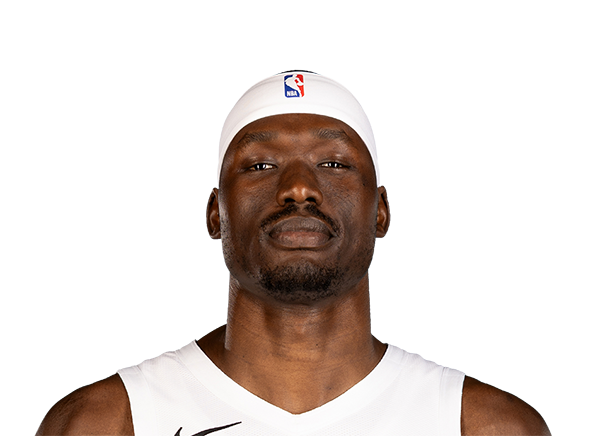
Duop Reath
#25

Mark Williams
Team Statistics
Magic
10th in Eastern Conference Division
VS
Suns
3rd in Pacific Division
General
38.9
Rebounds Per Game
39.5
1.5
Assist To Turnover Ratio
2.0
23.7
Fouls Per Game
23.8
7
Games Played
6
0
Games Started
0
0
Minutes
0
0.0
Minutes Per Game
0.0
272
Rebounds
237
272
Rebounds
237
Offensive
78.3
Free Throw Percentage
78.2
34.3
3-Point Field Goal Percentage
33.9
37.0
Average Field Goals Made
41.0
81.7
Average Field Goals Attempted
88.7
13.1
Average 3-Point Field Goals Made
12.8
38.3
Average 3-Point Field Goals Attempted
37.8
18.6
Average Free Throws Made
18.5
23.7
Average Free Throws Attempted
23.7
105.7
Points Per Game
113.3
9.3
Offensive Rebounds Per Game
12.3
25.9
Assists Per Game
27.3
16.7
Turnovers Per Game
14.0
54.9
2-Point Field Goal Percentage
55.4
1.294
Scoring Efficiency
1.278
0.53
Shooting Efficiency
0.53
45.3
Field Goal Percentage
46.2
167.0
2-Point Field Goals Made
169.0
304.0
2-Point Field Goals Attempted
305.0
740
Points
680
65
Offensive Rebounds
74
181
Assists
164
117
Turnovers
84
259
Field Goals Made
246
572
Field Goals Attempted
532
130
Free Throws Made
111
166
Free Throws Attempted
142
92
3-Point Field Goals Made
77
268
3-Point Field Goals Attempted
227
34.3
3-Point Field Goal Percentage
33.9
23.9
2-Point Field Goals Made per Game
28.2
43.4
2-Point Field Goals Attempted per Game
50.8
Defensive
29.6
Defensive Rebounds Per Game
27.2
3.7
Blocks Per Game
5.5
6.9
Steals Per Game
8.7
207
Defensive Rebounds
163
48
Steals
52
26
Blocks
33