

Mavericks vs 76ers Live Score (18 Dec, 2026)
Game Information
League
NBA
Season
1
Date
December 17, 2026
Tipoff
7:00 PM EST
Status
Scheduled
Team Stats
 DAL
Game Comparison
PHI
-Points-
-Rebounds-
-Assists-
46Field Goal %46
-3-Point %-
-Free Throw %-
Game Leaders
DALPHI
 —#
Points
—
—#
—#
Rebounds
—
—#
—#
Assists
—
—#
Injury Report
H2H / Season Series
Last 5 Games





NBA Standings
Western Conference — Southwest
| Team | W | L | PCT | GB | STRK |
|---|---|---|---|---|---|
 San Antonio | 13 | 3 | .813 | - | W1 |
 Houston | 12 | 4 | .750 | 1 | W1 |
 Memphis | 12 | 4 | .750 | 1 | W5 |
| Dallas | 8 | 7 | .533 | 4.5 | W1 |
 New Orleans | 5 | 11 | .313 | 8 | L1 |
Eastern Conference — Atlantic
| Team | W | L | PCT | GB | STRK |
|---|---|---|---|---|---|
| Philadelphia | 13 | 3 | .813 | - | W4 |
 Boston | 11 | 4 | .733 | 1.5 | L2 |
 New York | 9 | 6 | .600 | 3.5 | W3 |
 Toronto | 5 | 10 | .333 | 7.5 | L6 |
 Brooklyn | 3 | 11 | .214 | 9 | L3 |
Rosters
Mavericks
9th in Western Conference Division
VS
76ers
1st in Atlantic Division
Forward
#32
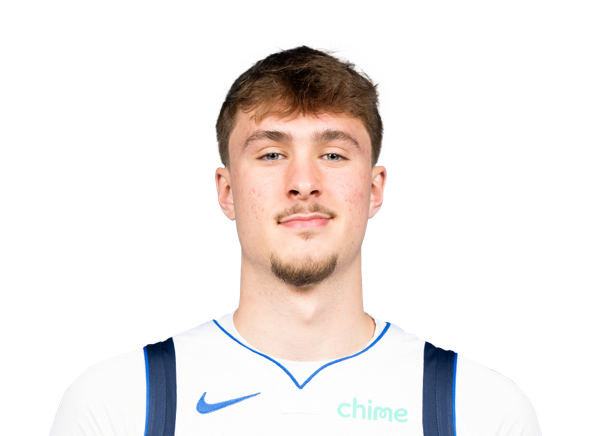
Cooper Flagg
#25
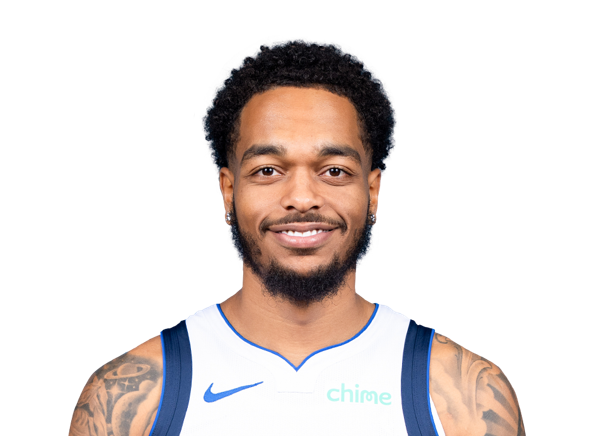
P.J. Washington
#3
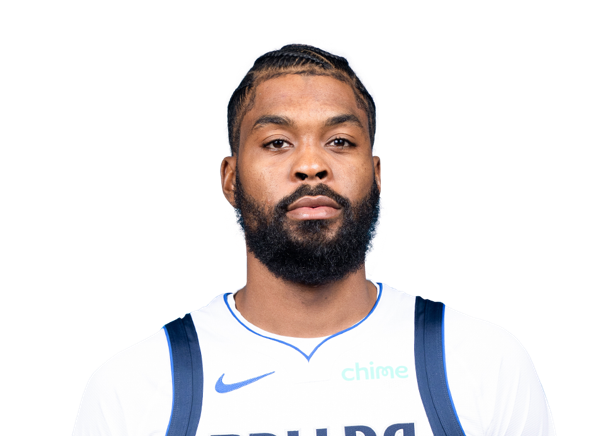
Naji Marshall
#21
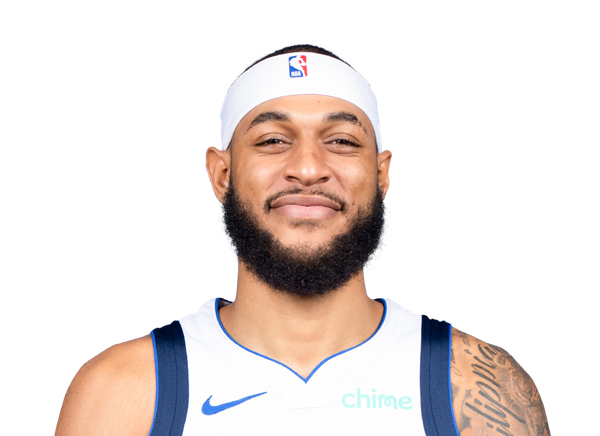
Daniel Gafford
#10

Zaccharie Risacher
#14
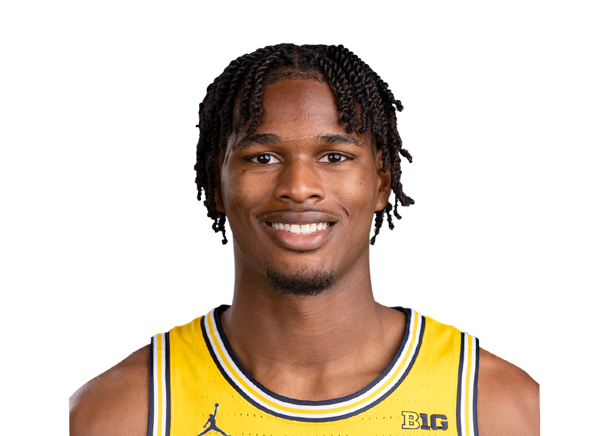
Morez Johnson Jr.
#16

Caleb Martin
#34

Santi Aldama
#55

Sergio de Larrea
#33

Tobi Lawal
#13
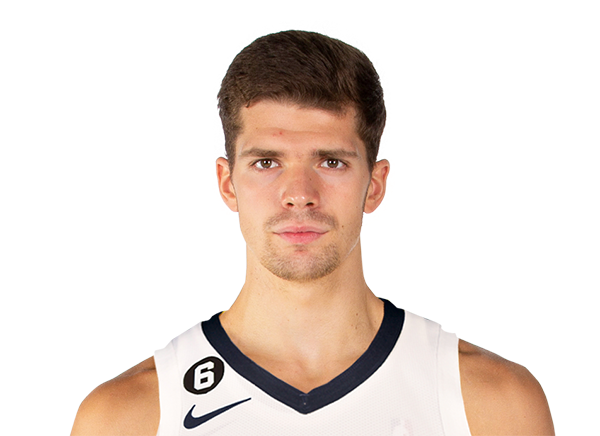
Tarik Biberovic
Guard
#11
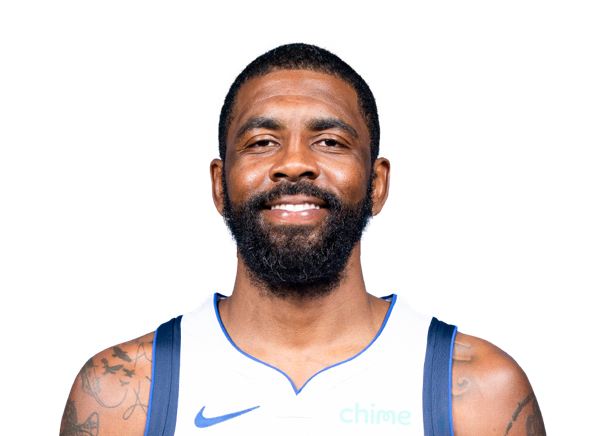
Kyrie Irving
#1
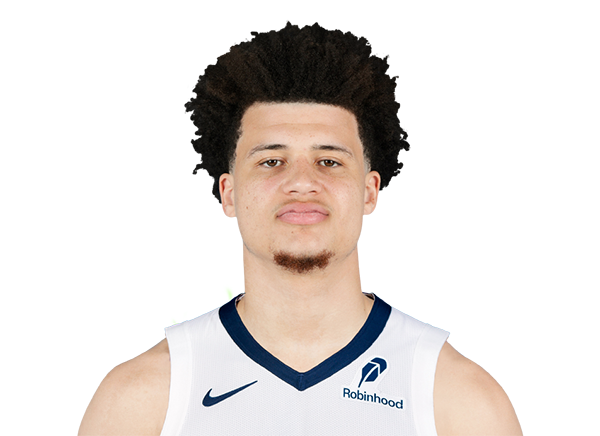
Walter Clayton Jr.

Max Christie
#8

Marcus Sasser
#9

Jett Howard
Center
#30
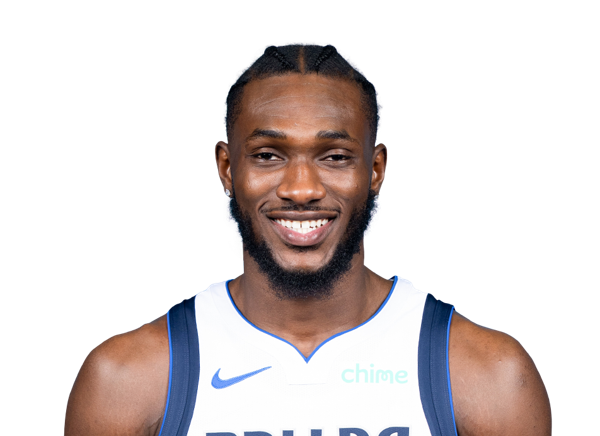
Moussa Cisse
#2
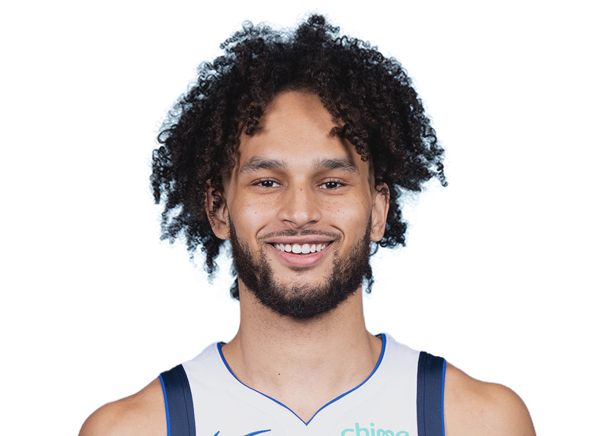
Dereck Lively II
Guard
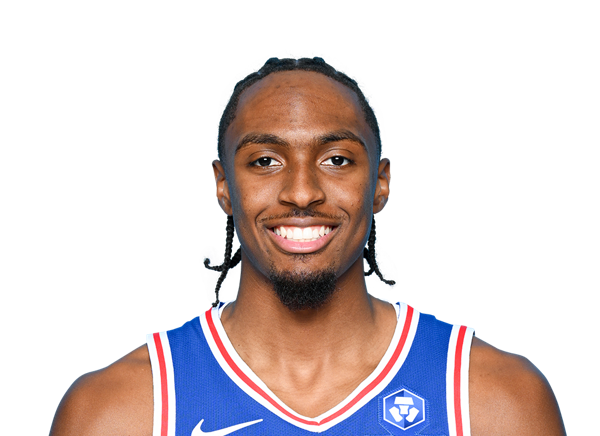
Tyrese Maxey
#7

Jaylen Brown
#77
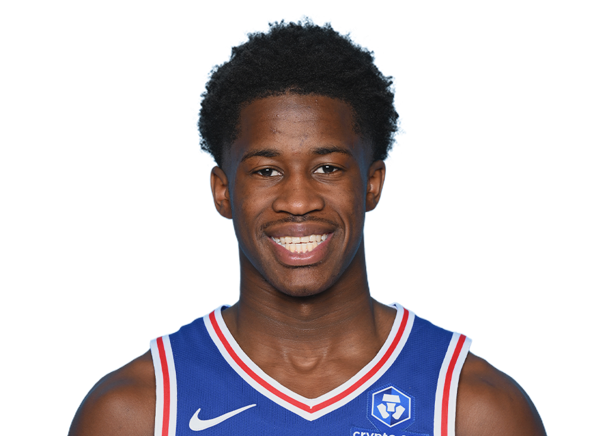
VJ Edgecombe
#5
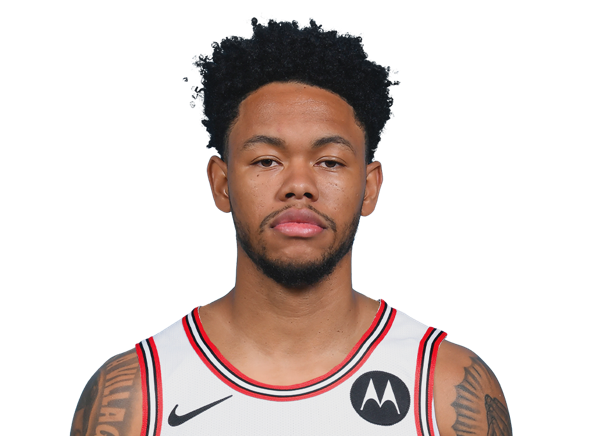
Anfernee Simons
#1

Kentavious Caldwell-Pope
#00

Labaron Philon Jr.
#8

Caleb Love
#12

Rayan Rupert
Center
#21
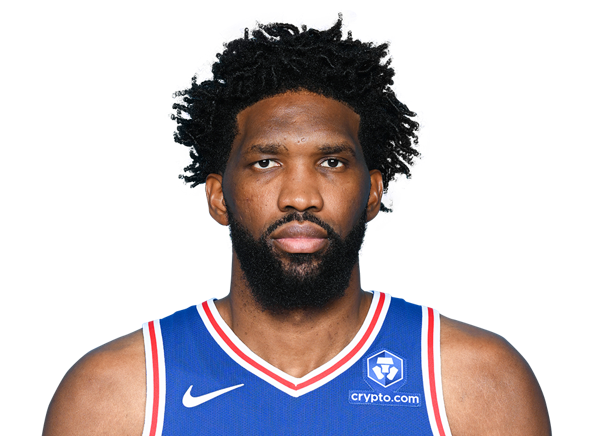
Joel Embiid
#30

Adem Bona
#99
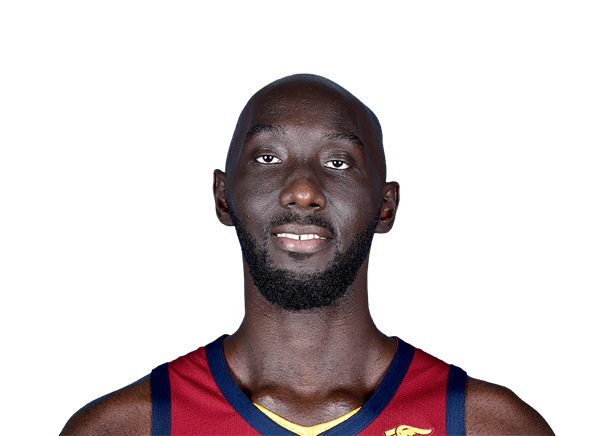
Tacko Fall
#55

Ariel Hukporti
Forward
#23
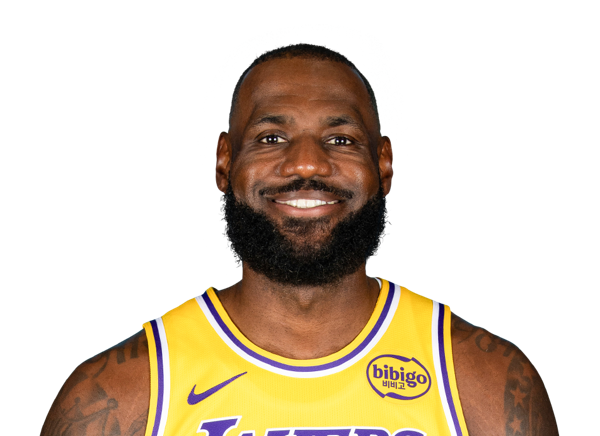
LeBron James
#33
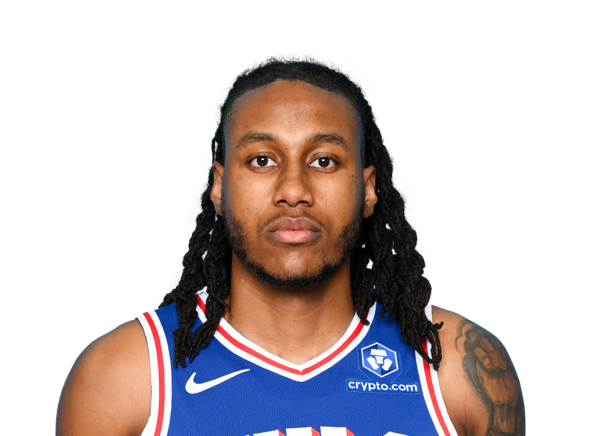
Jabari Walker
#45

Dean Wade
#25

Dominick Barlow
#11
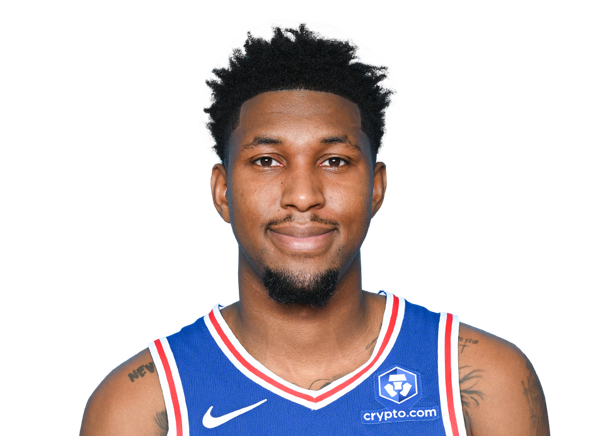
Justin Edwards
Team Statistics
Mavericks
9th in Western Conference Division
VS
76ers
1st in Atlantic Division
General
43.8
Rebounds Per Game
42.8
1.8
Assist To Turnover Ratio
2.3
21.6
Fouls Per Game
20.3
16
Games Played
17
0
Games Started
0
0
Minutes
0
0.0
Minutes Per Game
0.0
701
Rebounds
727
701
Rebounds
727
Offensive
77.7
Free Throw Percentage
80.1
34.4
3-Point Field Goal Percentage
35.3
40.5
Average Field Goals Made
40.8
88.1
Average Field Goals Attempted
87.5
12.9
Average 3-Point Field Goals Made
12.1
37.6
Average 3-Point Field Goals Attempted
34.1
18.3
Average Free Throws Made
21.8
23.5
Average Free Throws Attempted
27.2
112.2
Points Per Game
115.5
12.8
Offensive Rebounds Per Game
9.9
26.4
Assists Per Game
26.6
15.0
Turnovers Per Game
11.6
54.6
2-Point Field Goal Percentage
53.9
1.273
Scoring Efficiency
1.321
0.53
Shooting Efficiency
0.54
46.0
Field Goal Percentage
46.7
441.0
2-Point Field Goals Made
489.0
808.0
2-Point Field Goals Attempted
907.0
1795
Points
1964
205
Offensive Rebounds
169
423
Assists
453
240
Turnovers
197
648
Field Goals Made
694
1410
Field Goals Attempted
1487
292
Free Throws Made
371
376
Free Throws Attempted
463
207
3-Point Field Goals Made
205
602
3-Point Field Goals Attempted
580
34.4
3-Point Field Goal Percentage
35.3
27.6
2-Point Field Goals Made per Game
28.8
50.5
2-Point Field Goals Attempted per Game
53.4
Defensive
31.0
Defensive Rebounds Per Game
32.8
5.5
Blocks Per Game
4.4
8.8
Steals Per Game
7.9
496
Defensive Rebounds
558
141
Steals
135
88
Blocks
74