

Mavericks vs Nuggets Live Score (5 Feb, 2027)
Game Information
League
NBA
Season
1
Date
February 4, 2027
Tipoff
10:00 PM EST
Status
Scheduled
Team Stats
 DAL
Game Comparison
DEN
-Points-
-Rebounds-
-Assists-
47Field Goal %49
-3-Point %-
-Free Throw %-
Game Leaders
DALDEN
 —#
Points
—
—#
—#
Rebounds
—
—#
—#
Assists
—
—#
Injury Report
H2H / Season Series
Last 5 Games





NBA Standings
Western Conference — Southwest
| Team | W | L | PCT | GB | STRK |
|---|---|---|---|---|---|
 Houston | 7 | 2 | .778 | - | L1 |
 San Antonio | 6 | 2 | .750 | 0.5 | W6 |
 Memphis | 6 | 2 | .750 | 0.5 | L2 |
 New Orleans | 4 | 4 | .500 | 2.5 | W4 |
| Dallas | 4 | 4 | .500 | 2.5 | L2 |
Western Conference — Northwest
| Team | W | L | PCT | GB | STRK |
|---|---|---|---|---|---|
 Portland | 6 | 1 | .857 | - | W3 |
 Oklahoma City | 6 | 2 | .750 | 0.5 | W2 |
 Minnesota | 6 | 3 | .667 | 1 | W2 |
| Denver | 4 | 3 | .571 | 2 | W1 |
 Utah | 1 | 7 | .125 | 5.5 | L6 |
Rosters
Mavericks
10th in Western Conference Division
VS
Nuggets
8th in Western Conference Division
Forward
#32
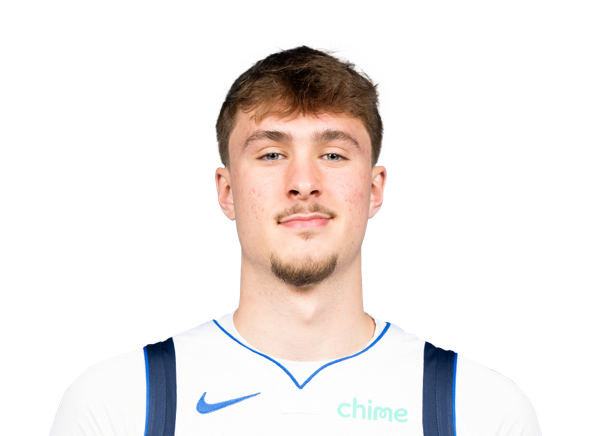
Cooper Flagg
#25
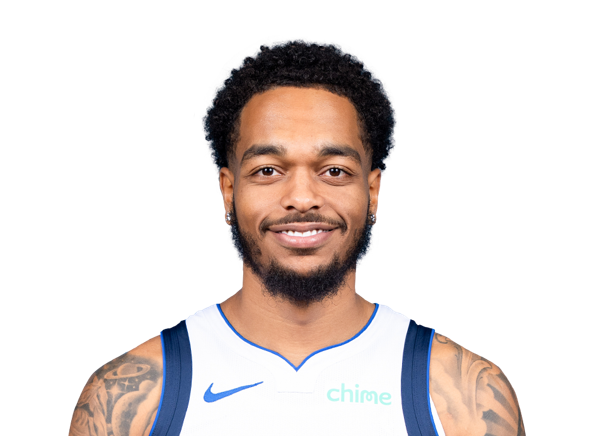
P.J. Washington
#3
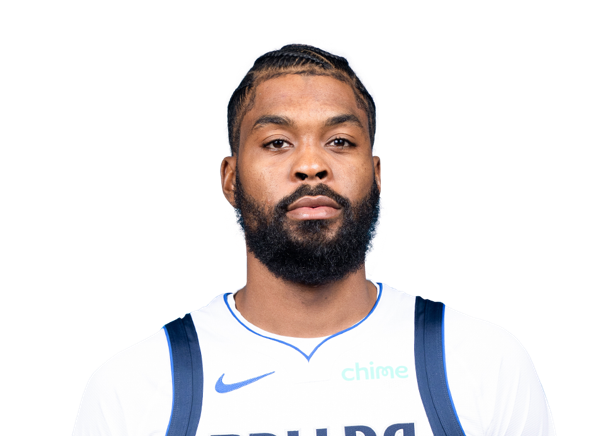
Naji Marshall
#10

Zaccharie Risacher
#21
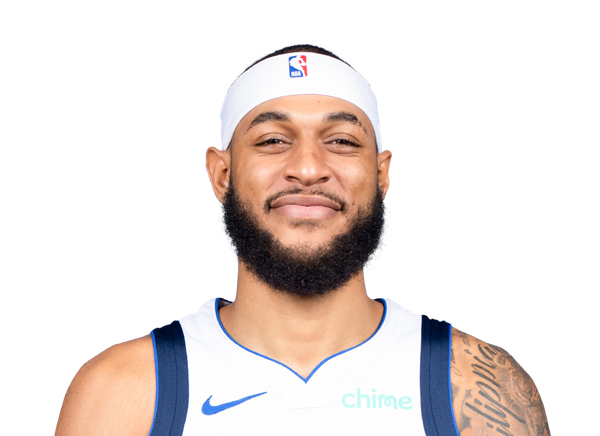
Daniel Gafford
#14
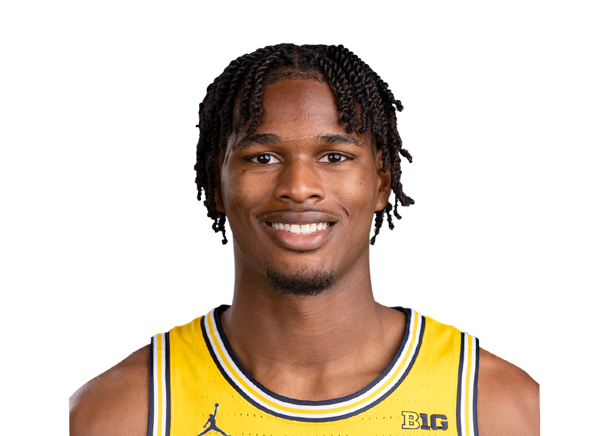
Morez Johnson Jr.
#16

Caleb Martin
#34

Santi Aldama
#55

Sergio de Larrea
#33

Tobi Lawal
#13
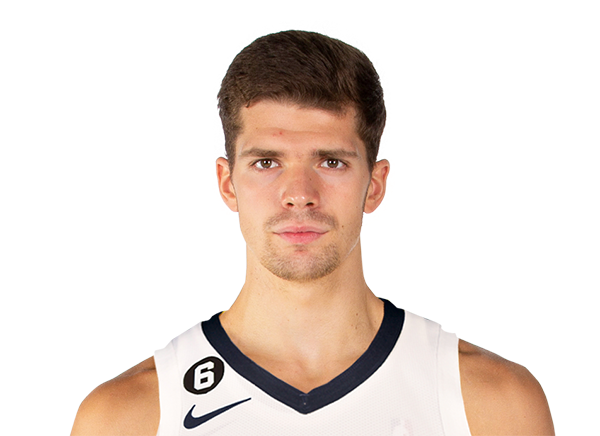
Tarik Biberovic
Guard
#11
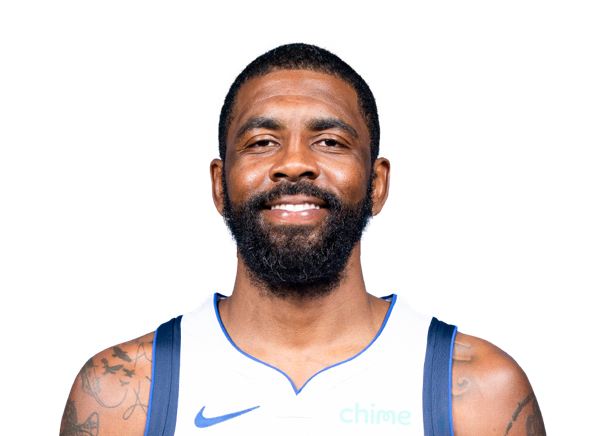
Kyrie Irving
#1
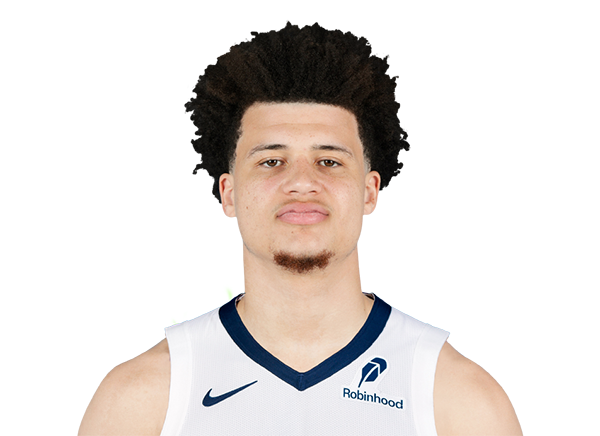
Walter Clayton Jr.
#8

Marcus Sasser

Max Christie
#9

Jett Howard
Center
#30
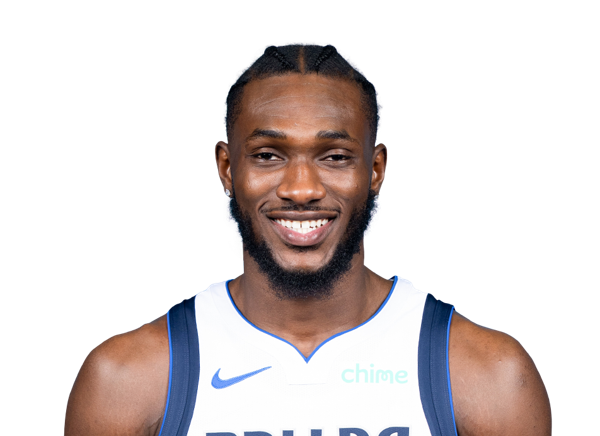
Moussa Cisse
#2
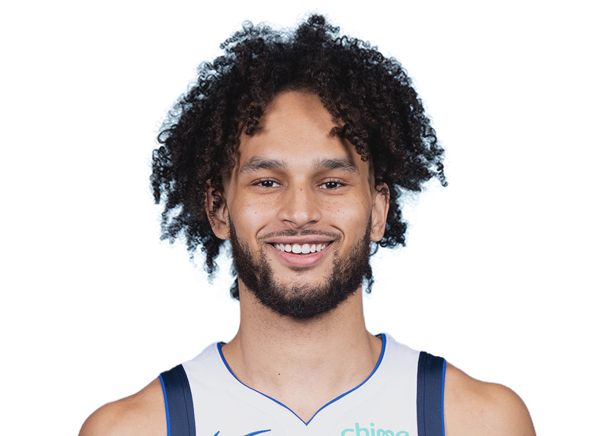
Dereck Lively II
Guard
#27
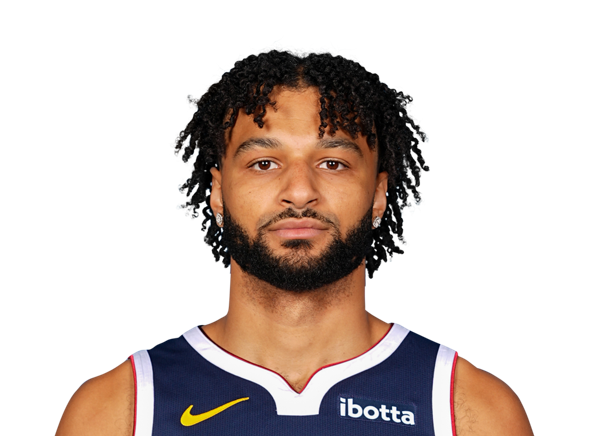
Jamal Murray

Christian Braun
#10
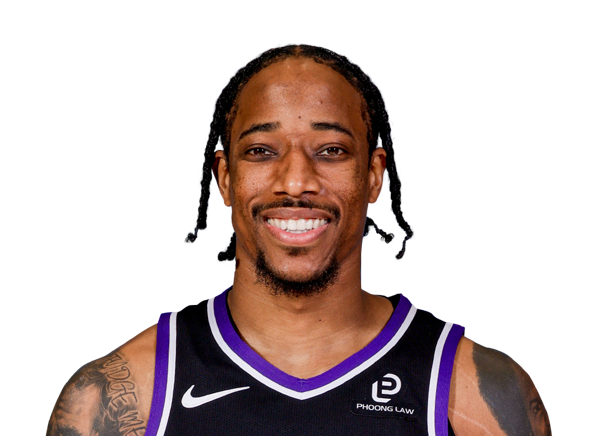
DeMar DeRozan
#5
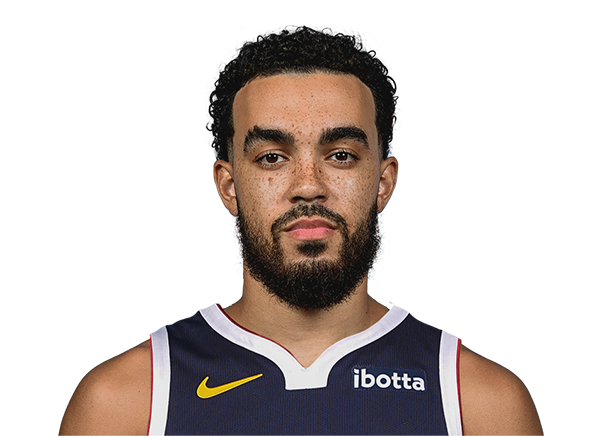
Tyus Jones
#9

Ryan Nembhard
#1
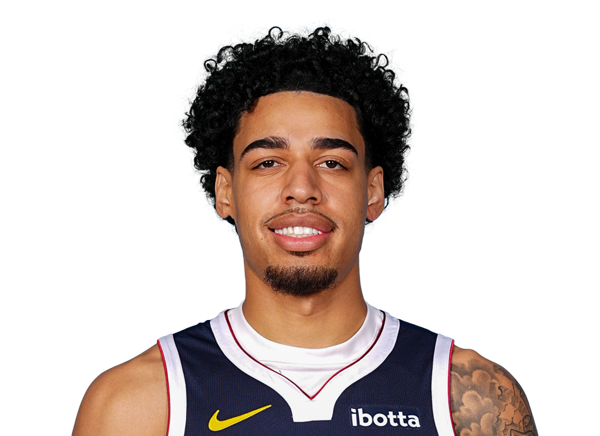
Julian Strawther
Center
#15

Nikola Jokic
Forward
#23
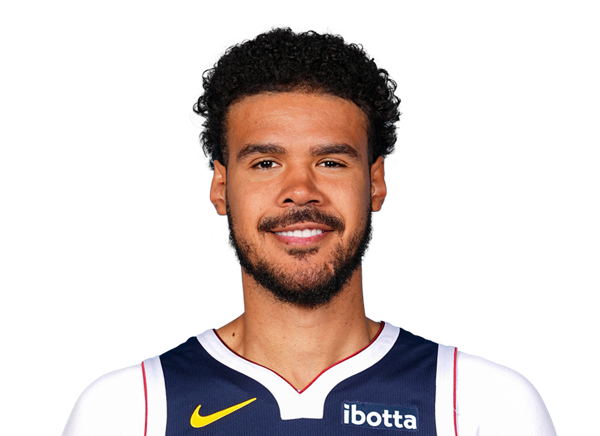
Cameron Johnson
#32

Aaron Gordon
#7
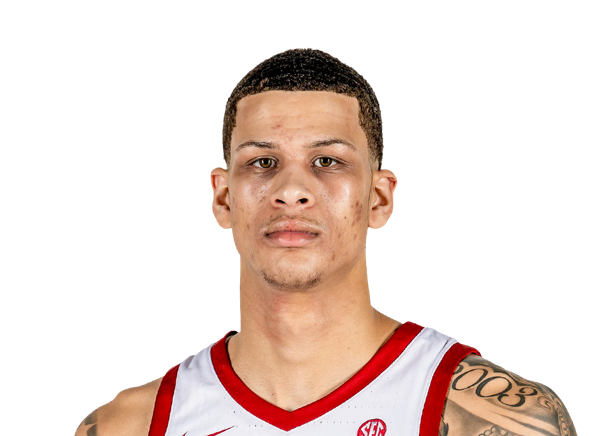
Trevon Brazile
#3

Marvin Bagley III
#13

Bryce Hopkins
#21
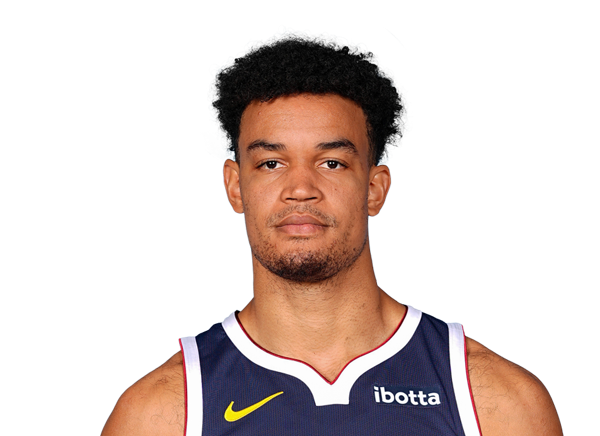
Spencer Jones
#00
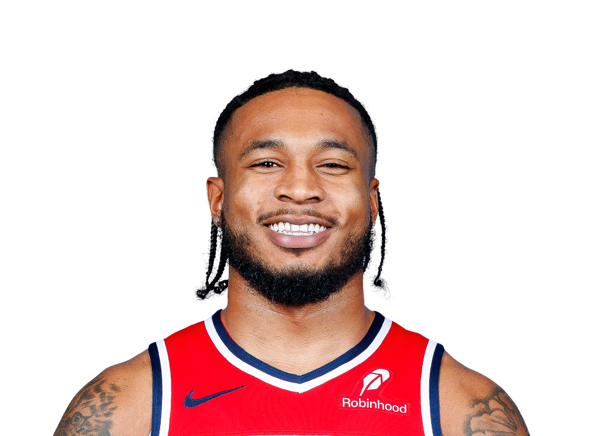
Cam Whitmore
#22

Zeke Nnaji
#11
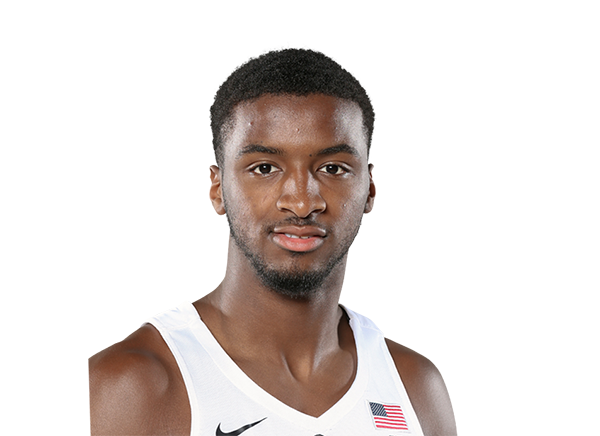
Alpha Diallo
#14

DaRon Holmes II
Team Statistics
Mavericks
10th in Western Conference Division
VS
Nuggets
8th in Western Conference Division
General
43.2
Rebounds Per Game
42.3
1.7
Assist To Turnover Ratio
2.2
21.8
Fouls Per Game
19.0
14
Games Played
11
0
Games Started
0
0
Minutes
0
0.0
Minutes Per Game
0.0
605
Rebounds
465
605
Rebounds
465
Offensive
78.6
Free Throw Percentage
79.0
33.5
3-Point Field Goal Percentage
34.9
40.6
Average Field Goals Made
41.5
88.4
Average Field Goals Attempted
85.2
12.6
Average 3-Point Field Goals Made
10.8
37.7
Average 3-Point Field Goals Attempted
31.0
18.1
Average Free Throws Made
20.9
23.1
Average Free Throws Attempted
26.5
112.1
Points Per Game
114.6
12.6
Offensive Rebounds Per Game
10.1
26.1
Assists Per Game
27.7
15.1
Turnovers Per Game
12.5
55.3
2-Point Field Goal Percentage
56.5
1.268
Scoring Efficiency
1.346
0.53
Shooting Efficiency
0.55
46.0
Field Goal Percentage
48.7
392.0
2-Point Field Goals Made
337.0
709.0
2-Point Field Goals Attempted
596.0
1569
Points
1261
176
Offensive Rebounds
111
366
Assists
305
212
Turnovers
137
569
Field Goals Made
456
1237
Field Goals Attempted
937
254
Free Throws Made
230
323
Free Throws Attempted
291
177
3-Point Field Goals Made
119
528
3-Point Field Goals Attempted
341
33.5
3-Point Field Goal Percentage
34.9
28.0
2-Point Field Goals Made per Game
30.6
50.6
2-Point Field Goals Attempted per Game
54.2
Defensive
30.6
Defensive Rebounds Per Game
32.2
5.6
Blocks Per Game
4.5
8.6
Steals Per Game
9.0
429
Defensive Rebounds
354
120
Steals
99
78
Blocks
50