

Nets vs Heat Live Score (13 Jan, 2027)
Game Information
League
NBA
Season
1
Date
January 12, 2027
Tipoff
7:30 PM EST
Status
Scheduled
Team Stats
 BKN
Game Comparison
MIA

-Points-
-Rebounds-
-Assists-
-Field Goal %-
-3-Point %-
-Free Throw %-
Injury Report
Brooklyn Nets

H2H / Season Series
Last 5 Games



NBA Standings
Eastern Conference — Atlantic
| Team | W | L | PCT | GB | STRK |
|---|---|---|---|---|---|
| Brooklyn | 3 | 0 | 1.000 | - | W3 |
 Boston | 2 | 0 | 1.000 | 0.5 | W2 |
 Toronto | 2 | 1 | .667 | 1 | W2 |
 Philadelphia | 1 | 2 | .333 | 2 | L2 |
 New York | 0 | 4 | .000 | 3.5 | L4 |
Eastern Conference — Southeast
| Team | W | L | PCT | GB | STRK |
|---|---|---|---|---|---|
 Atlanta | 3 | 1 | .750 | - | W3 |
| Miami | 2 | 1 | .667 | 0.5 | L1 |
 Washington | 2 | 1 | .667 | 0.5 | L1 |
 Orlando | 2 | 1 | .667 | 0.5 | W1 |
 Charlotte | 1 | 1 | .500 | 1 | W1 |
Rosters
Nets
5th in Atlantic Division
VS
Heat
10th in Eastern Conference Division
Forward
#30
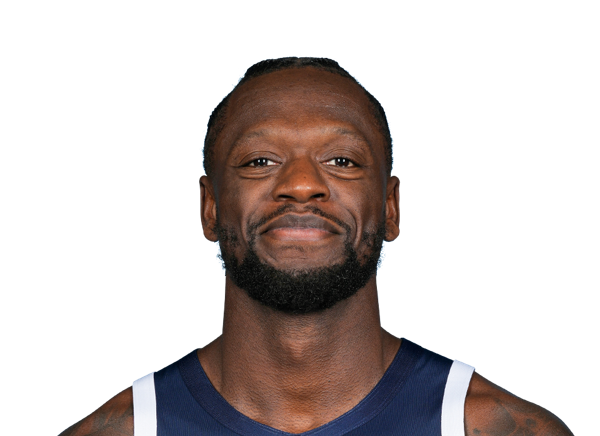
Julius Randle
#17
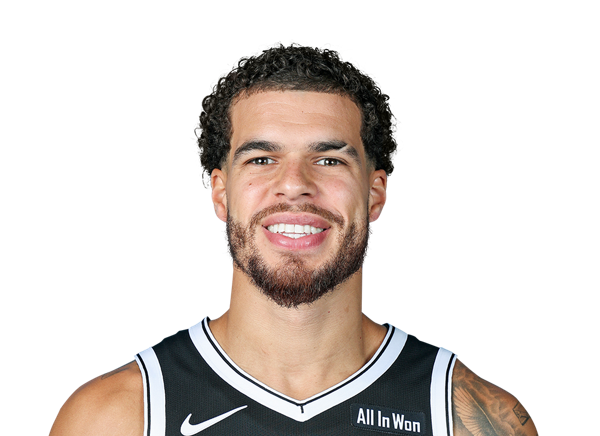
Michael Porter Jr.
#31

Chaney Johnson
#21
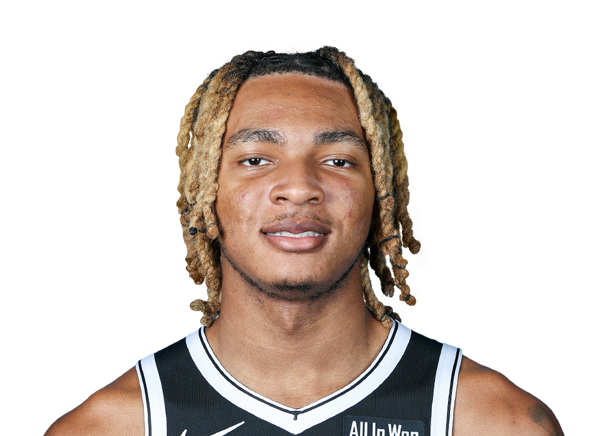
Noah Clowney
#00

Josh Minott
#2

Danny Wolf
#9

Joshua Jefferson
#34

Tyler Bilodeau
Guard
#10

Nolan Traore
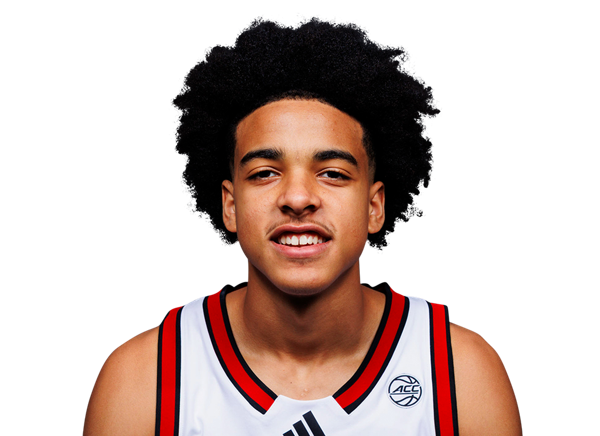
Mikel Brown Jr.
#1

Keon Ellis
#8

Egor Demin
#77

Ben Saraf
#14

Terance Mann
#4

Drake Powell
Center
#13

Moritz Wagner
#20

Day'Ron Sharpe
Forward
#7
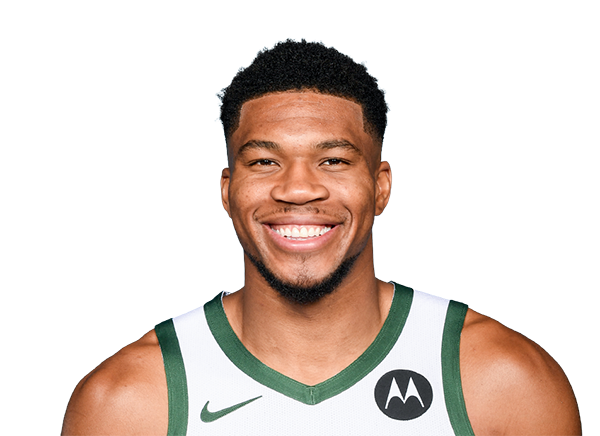
Giannis Antetokounmpo
#22

Andrew Wiggins
#95

Bobby Portis
#5

Nikola Jovic

Simone Fontecchio
#15

Myron Gardner
Center
#13

Bam Adebayo
#8

Nick Richards
Guard
#2

Davion Mitchell
#11
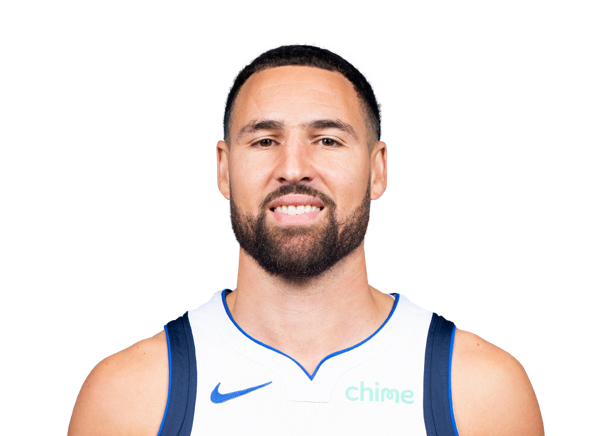
Klay Thompson
#9

Pelle Larsson
#10

Tim Hardaway Jr.
#12

Dru Smith
#4

Ryan Conwell
Team Statistics
Nets
5th in Atlantic Division
VS
Heat
10th in Eastern Conference Division
General
43.6
Rebounds Per Game
42.3
1.3
Assist To Turnover Ratio
1.9
25.6
Fouls Per Game
21.1
7
Games Played
7
0
Games Started
0
0
Minutes
0
0.0
Minutes Per Game
0.0
305
Rebounds
296
305
Rebounds
296
Offensive
76.9
Free Throw Percentage
73.0
35.0
3-Point Field Goal Percentage
34.8
35.0
Average Field Goals Made
42.7
83.9
Average Field Goals Attempted
89.3
14.1
Average 3-Point Field Goals Made
13.4
40.4
Average 3-Point Field Goals Attempted
38.6
21.4
Average Free Throws Made
19.3
27.9
Average Free Throws Attempted
26.4
105.6
Points Per Game
118.1
11.3
Offensive Rebounds Per Game
10.6
22.4
Assists Per Game
28.7
17.3
Turnovers Per Game
15.1
48.0
2-Point Field Goal Percentage
57.7
1.259
Scoring Efficiency
1.323
0.50
Shooting Efficiency
0.55
41.7
Field Goal Percentage
47.8
146.0
2-Point Field Goals Made
205.0
304.0
2-Point Field Goals Attempted
355.0
739
Points
827
79
Offensive Rebounds
74
157
Assists
201
121
Turnovers
106
245
Field Goals Made
299
587
Field Goals Attempted
625
150
Free Throws Made
135
195
Free Throws Attempted
185
99
3-Point Field Goals Made
94
283
3-Point Field Goals Attempted
270
35.0
3-Point Field Goal Percentage
34.8
20.9
2-Point Field Goals Made per Game
29.3
43.4
2-Point Field Goals Attempted per Game
50.7
Defensive
32.3
Defensive Rebounds Per Game
31.7
5.0
Blocks Per Game
5.0
8.7
Steals Per Game
8.1
226
Defensive Rebounds
222
61
Steals
57
35
Blocks
35