

Nets vs Magic Live Score (31 Jan, 2027)
Game Information
League
NBA
Season
1
Date
January 31, 2027
Tipoff
6:00 PM EST
Status
Scheduled
Team Stats
 BKN
Game Comparison
ORL

-Points-
-Rebounds-
-Assists-
42Field Goal %46
-3-Point %-
-Free Throw %-
Game Leaders
BKNORL
 —#
Points
—
—#
—#Rebounds
—
—#
—#Assists
—
—#
Injury Report
H2H / Season Series
Last 5 Games




NBA Standings
Eastern Conference — Atlantic
| Team | W | L | PCT | GB | STRK |
|---|---|---|---|---|---|
 Philadelphia | 6 | 1 | .857 | - | W3 |
 Boston | 5 | 1 | .833 | 0.5 | W5 |
 Toronto | 3 | 2 | .600 | 2 | L1 |
 New York | 2 | 4 | .333 | 3.5 | L1 |
| Brooklyn | 0 | 5 | .000 | 5 | L5 |
Eastern Conference — Southeast
| Team | W | L | PCT | GB | STRK |
|---|---|---|---|---|---|
 Washington | 3 | 3 | .500 | - | W1 |
 Atlanta | 3 | 4 | .429 | 0.5 | L1 |
 Charlotte | 3 | 4 | .429 | 0.5 | L3 |
 Miami | 2 | 4 | .333 | 1 | W2 |
| Orlando | 2 | 4 | .333 | 1 | L1 |
Rosters
Nets
5th in Atlantic Division
VS
Magic
10th in Eastern Conference Division
Forward
#30
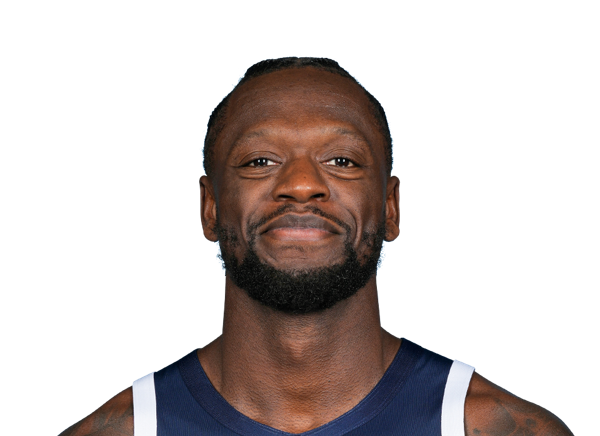
Julius Randle
#17
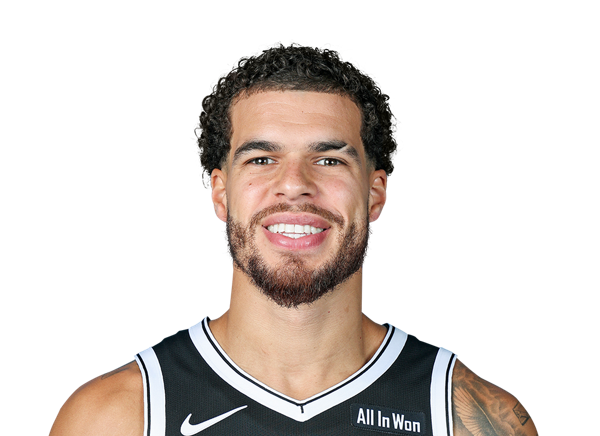
Michael Porter Jr.
#31

Chaney Johnson
#21
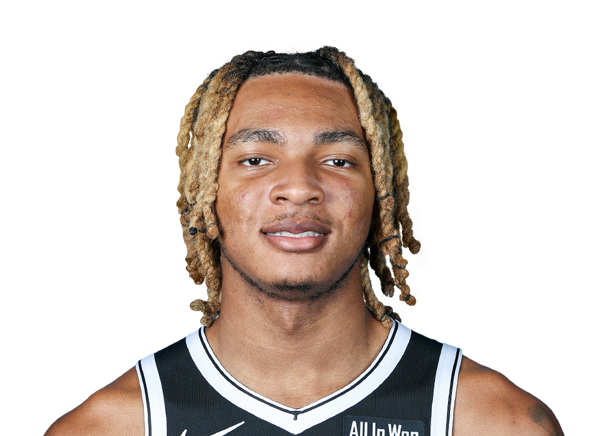
Noah Clowney
#00

Josh Minott
#2

Danny Wolf
#9

Joshua Jefferson
#34

Tyler Bilodeau
Guard
#10

Nolan Traore
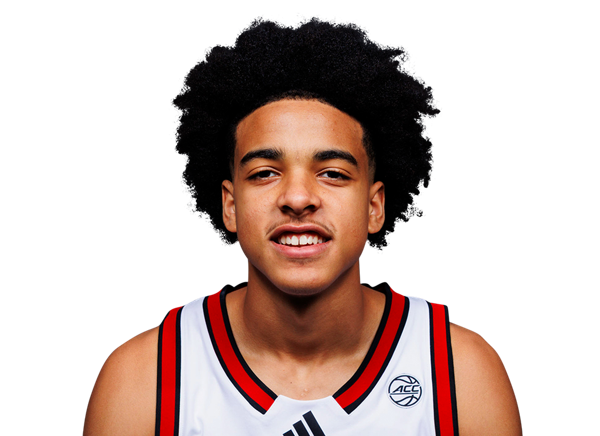
Mikel Brown Jr.
#1

Keon Ellis
#8

Egor Demin
#77

Ben Saraf
#14

Terance Mann
#4

Drake Powell
Center
#13
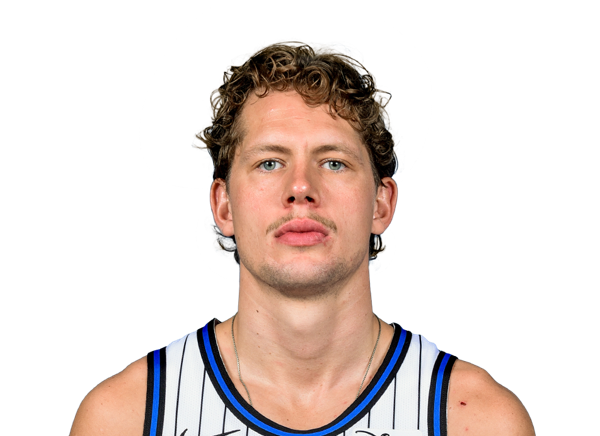
Moritz Wagner
#20
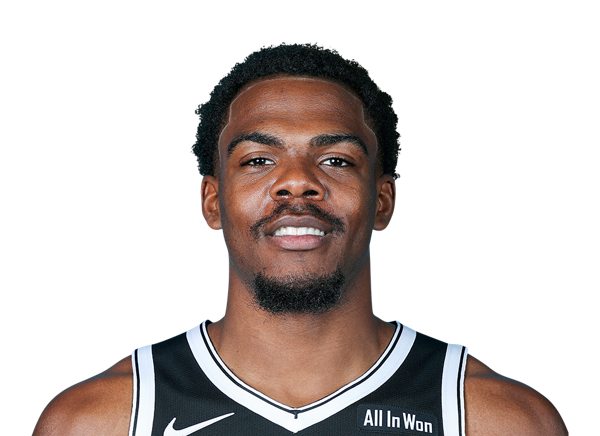
Day'Ron Sharpe
Forward
#22

Franz Wagner
#23
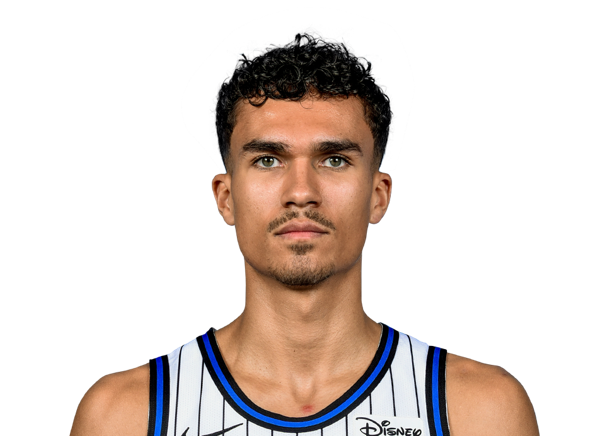
Tristan da Silva
#8

Jamal Cain
#5

Paolo Banchero
#1

Jonathan Isaac
#93
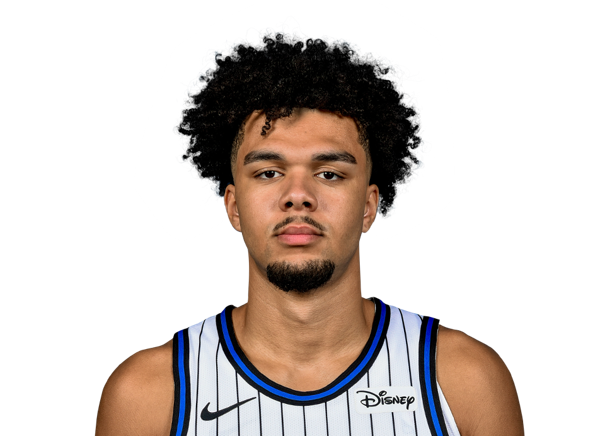
Noah Penda
#25
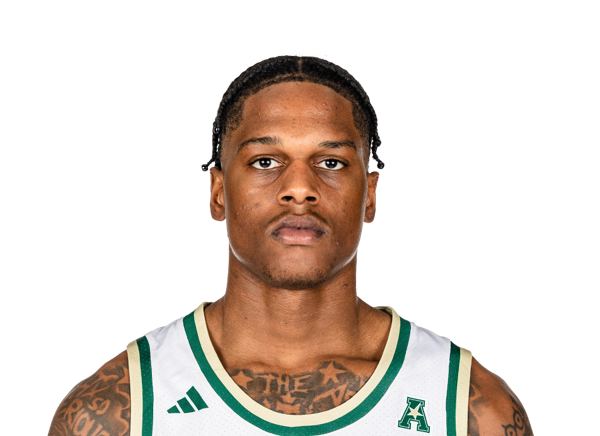
Izaiyah Nelson
Guard
#3

Desmond Bane
#11
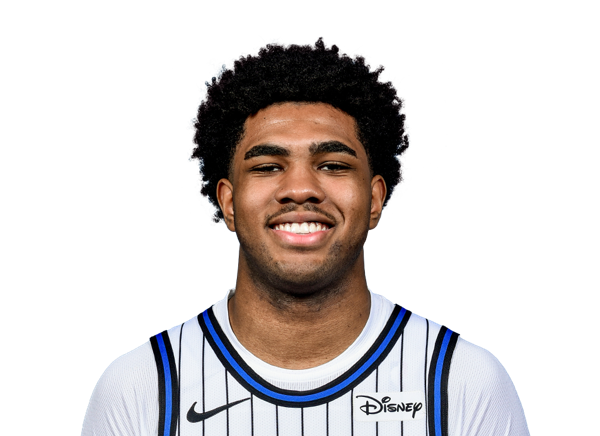
Jase Richardson
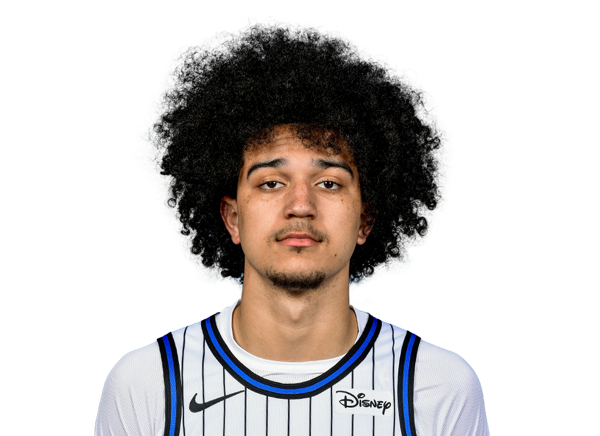
Anthony Black
#4

Jalen Suggs
#2

Jevon Carter
#30

Alex Morales
Center
#34
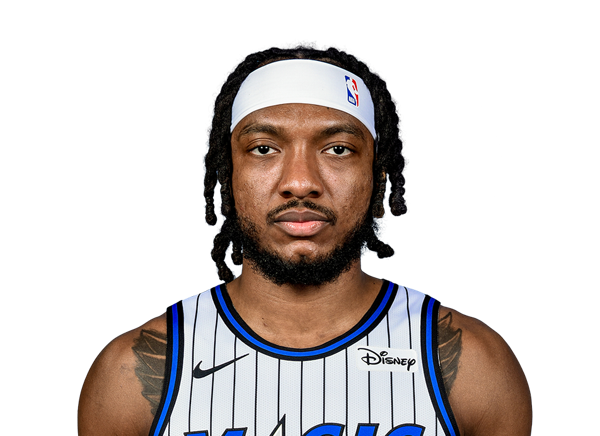
Wendell Carter Jr.
#35

Goga Bitadze
#9

Nikola Vucevic
#14

Colin Castleton
Team Statistics
Nets
5th in Atlantic Division
VS
Magic
10th in Eastern Conference Division
General
43.6
Rebounds Per Game
38.9
1.3
Assist To Turnover Ratio
1.5
25.6
Fouls Per Game
23.7
7
Games Played
7
0
Games Started
0
0
Minutes
0
0.0
Minutes Per Game
0.0
305
Rebounds
272
305
Rebounds
272
Offensive
76.9
Free Throw Percentage
78.3
35.0
3-Point Field Goal Percentage
34.3
35.0
Average Field Goals Made
37.0
83.9
Average Field Goals Attempted
81.7
14.1
Average 3-Point Field Goals Made
13.1
40.4
Average 3-Point Field Goals Attempted
38.3
21.4
Average Free Throws Made
18.6
27.9
Average Free Throws Attempted
23.7
105.6
Points Per Game
105.7
11.3
Offensive Rebounds Per Game
9.3
22.4
Assists Per Game
25.9
17.3
Turnovers Per Game
16.7
48.0
2-Point Field Goal Percentage
54.9
1.259
Scoring Efficiency
1.294
0.50
Shooting Efficiency
0.53
41.7
Field Goal Percentage
45.3
146.0
2-Point Field Goals Made
167.0
304.0
2-Point Field Goals Attempted
304.0
739
Points
740
79
Offensive Rebounds
65
157
Assists
181
121
Turnovers
117
245
Field Goals Made
259
587
Field Goals Attempted
572
150
Free Throws Made
130
195
Free Throws Attempted
166
99
3-Point Field Goals Made
92
283
3-Point Field Goals Attempted
268
35.0
3-Point Field Goal Percentage
34.3
20.9
2-Point Field Goals Made per Game
23.9
43.4
2-Point Field Goals Attempted per Game
43.4
Defensive
32.3
Defensive Rebounds Per Game
29.6
5.0
Blocks Per Game
3.7
8.7
Steals Per Game
6.9
226
Defensive Rebounds
207
61
Steals
48
35
Blocks
26