

Pelicans vs Kings Live Score (14 Dec, 2026)
Game Information
League
NBA
Season
1
Date
December 13, 2026
Tipoff
9:00 PM EST
Status
Scheduled
Team Stats
 NO
Game Comparison
SAC
-Points-
-Rebounds-
-Assists-
46Field Goal %46
-3-Point %-
-Free Throw %-
Game Leaders
NOSAC
 —#
Points
—
—#
—#
Rebounds
—
—#
—#
Assists
—
—#
Injury Report
New Orleans Pelicans
H2H / Season Series
Last 5 Games







NBA Standings
Western Conference — Southwest
| Team | W | L | PCT | GB | STRK |
|---|---|---|---|---|---|
 San Antonio | 13 | 3 | .813 | - | W1 |
 Houston | 12 | 4 | .750 | 1 | W1 |
 Memphis | 12 | 4 | .750 | 1 | W5 |
 Dallas | 8 | 7 | .533 | 4.5 | W1 |
| New Orleans | 5 | 11 | .313 | 8 | L1 |
Western Conference — Pacific
| Team | W | L | PCT | GB | STRK |
|---|---|---|---|---|---|
 LA Lakers | 13 | 3 | .813 | - | L1 |
 Golden State | 8 | 8 | .500 | 5 | L5 |
 Phoenix | 7 | 7 | .500 | 5 | W2 |
 LA Clippers | 4 | 10 | .286 | 8 | L2 |
| Sacramento | 1 | 13 | .071 | 11 | L7 |
Rosters
Pelicans
12th in Western Conference Division
VS
Kings
5th in Pacific Division
Forward
#1

Zion Williamson
#41
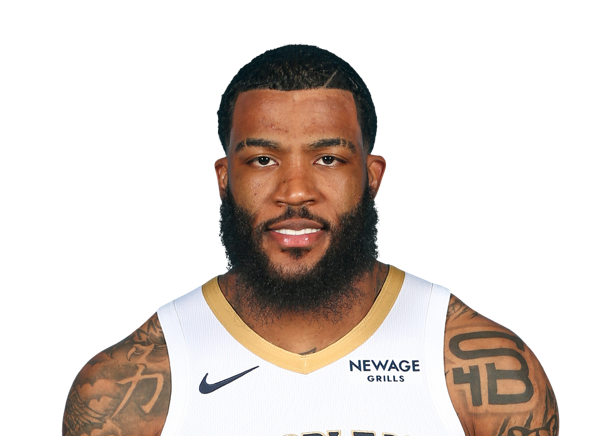
Saddiq Bey
#2

Herbert Jones
#17

Karlo Matkovic
#25

Trey Murphy III
#9
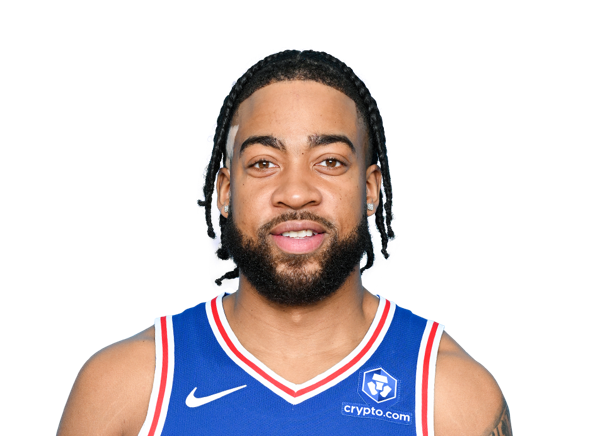
Trendon Watford
#8
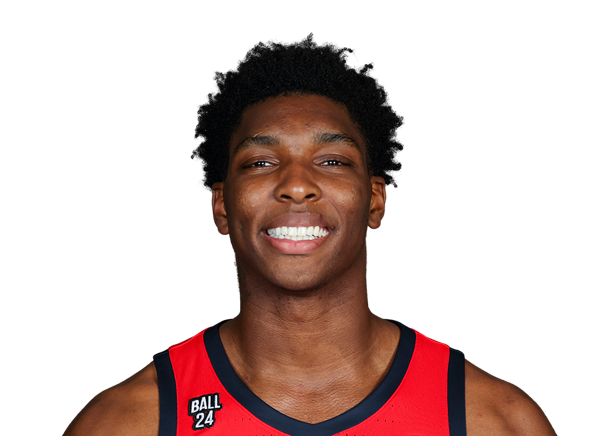
Malik Dia
#13
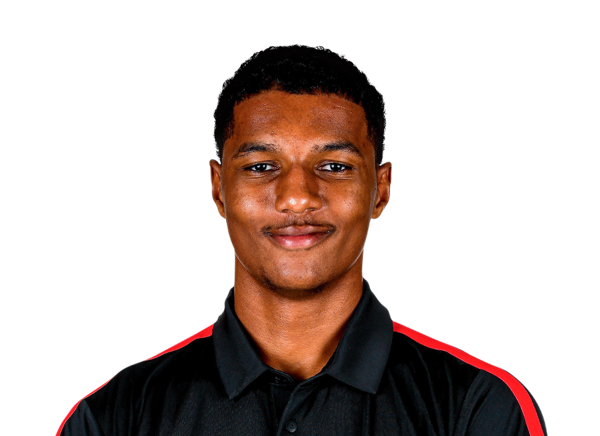
Julian Reese
Guard

Jeremiah Fears
#3

Jordan Poole
#24
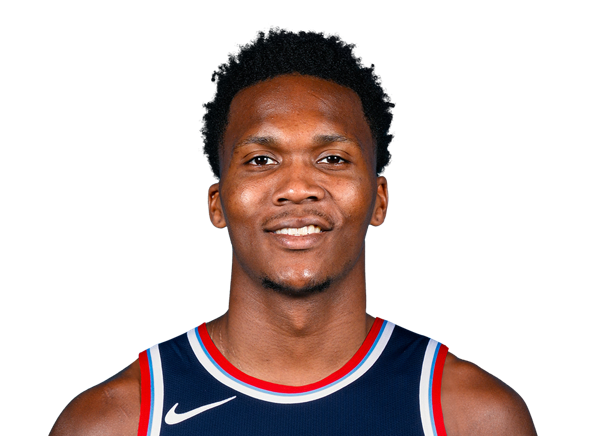
Bennedict Mathurin
#5

Dejounte Murray
#10

Jaron Pierre Jr.
#11

Bryce McGowens
#14
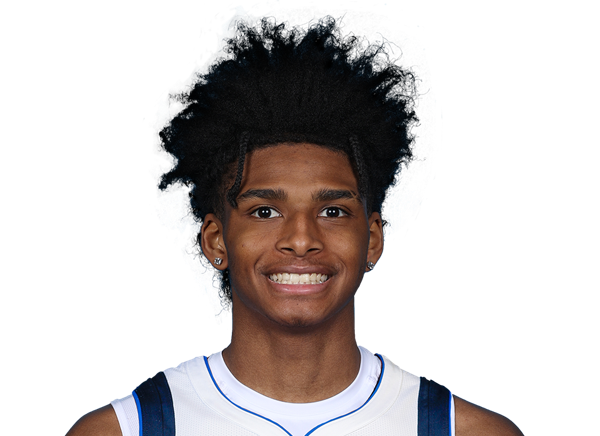
AJ Johnson
Center
#22
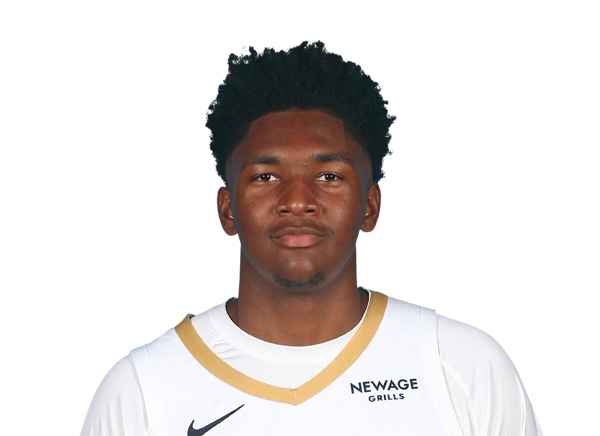
Derik Queen
#21
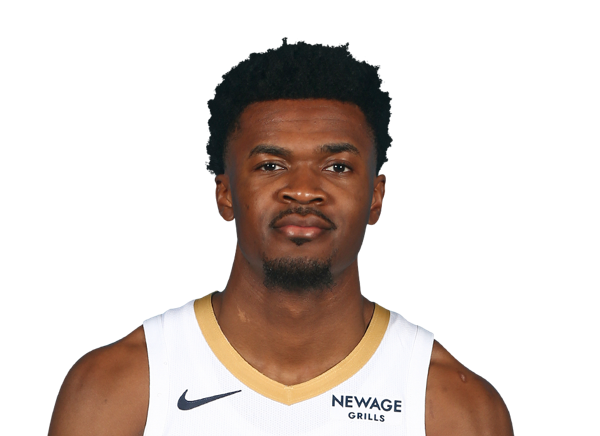
Yves Missi
#6

DeAndre Jordan
Guard
#5
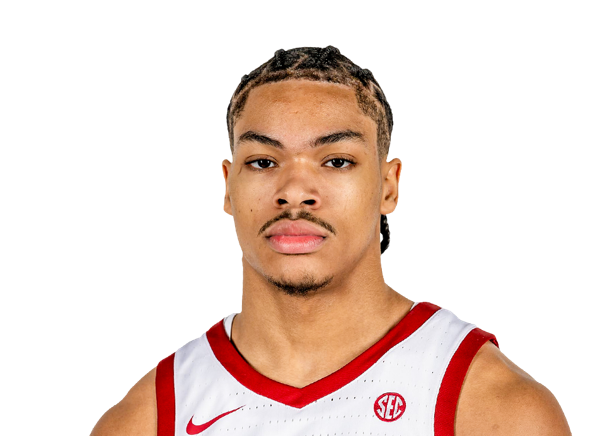
Darius Acuff Jr.
#8

Zach LaVine
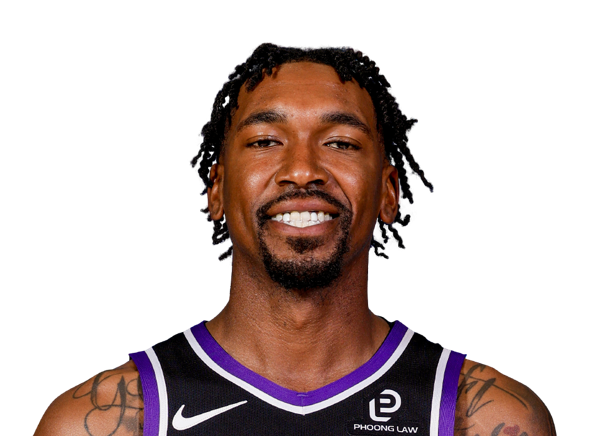
Malik Monk
#34
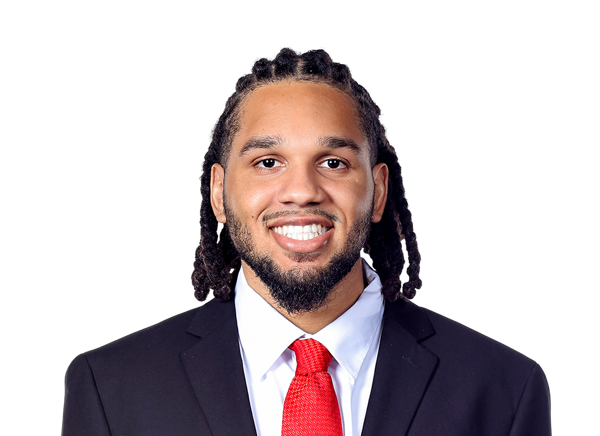
Emanuel Sharp
#29
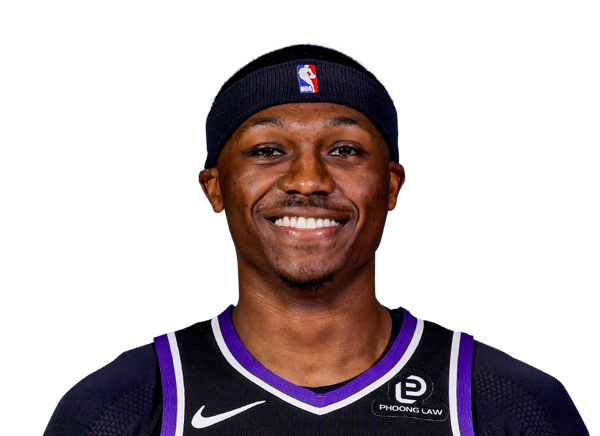
Daeqwon Plowden
#18
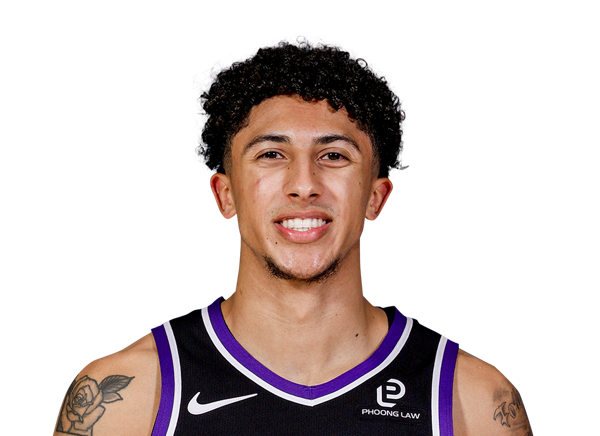
Nique Clifford
#25
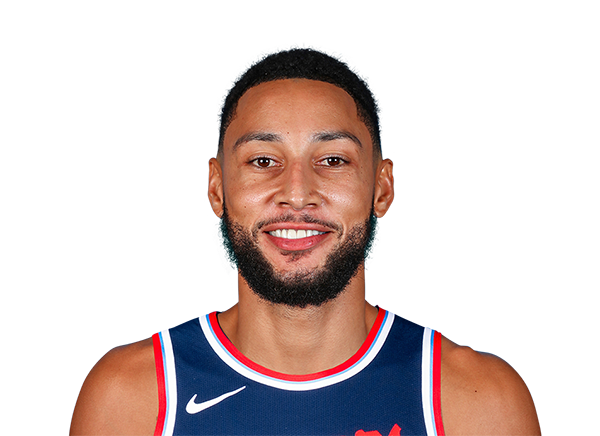
Ben Simmons
Forward
#15

De'Andre Hunter
#11
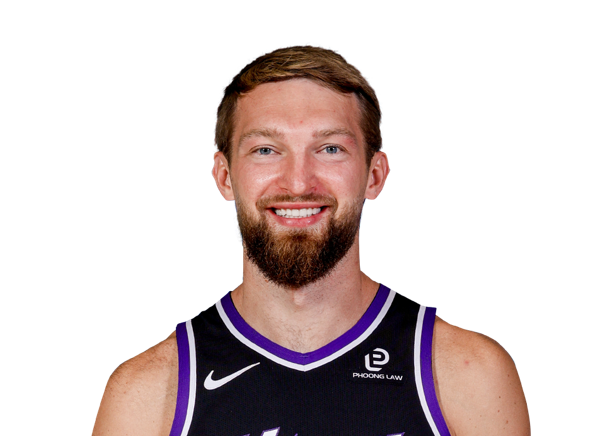
Domantas Sabonis
#9
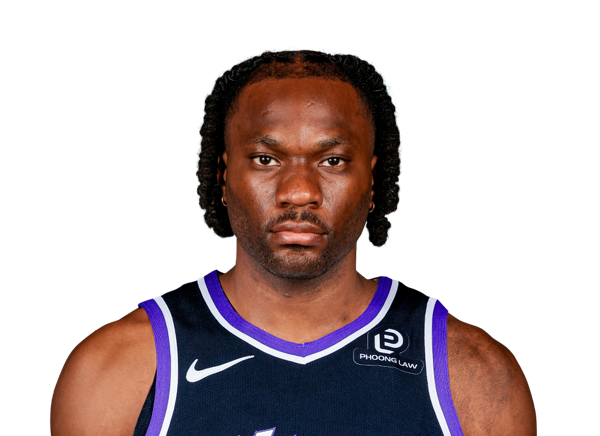
Precious Achiuwa
#19
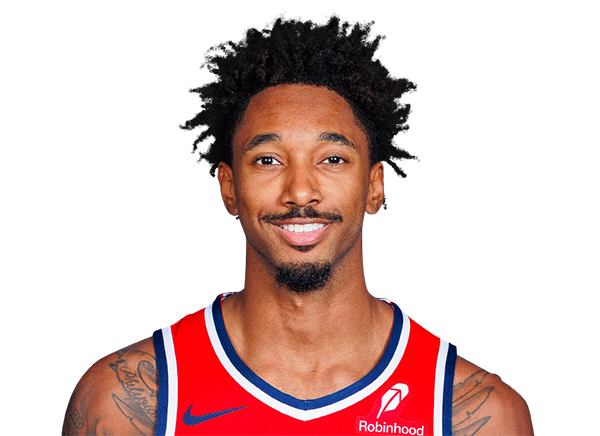
Leaky Black
#13
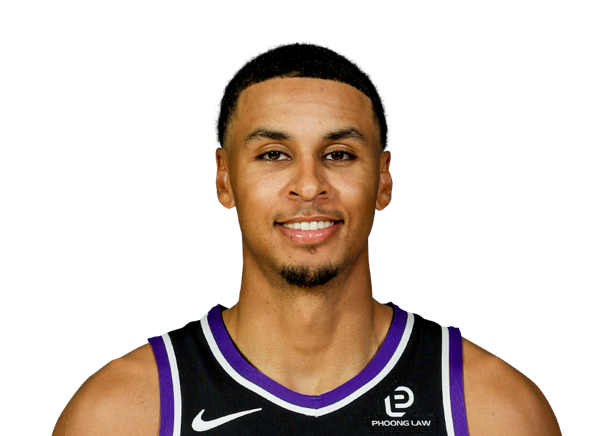
Keegan Murray
#22
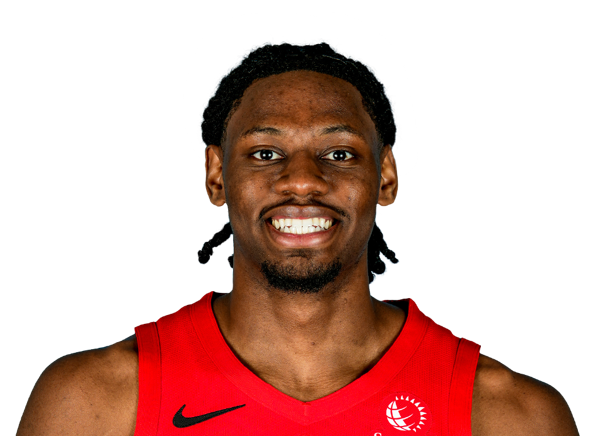
Jonathan Mogbo
#33
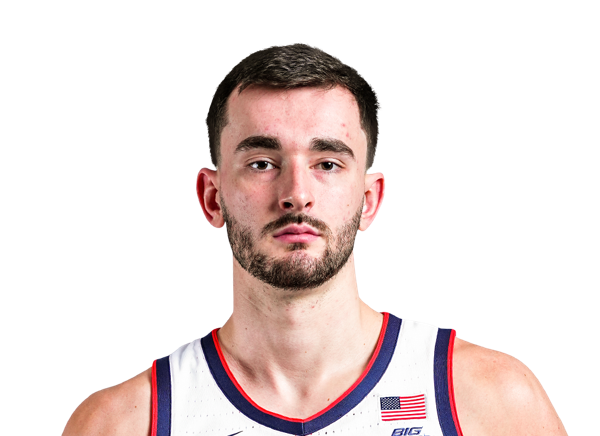
Alex Karaban
Center
#32
Dylan Cardwell
#24

Mason Plumlee
#42

Maxime Raynaud
Team Statistics
Pelicans
12th in Western Conference Division
VS
Kings
5th in Pacific Division
General
42.5
Rebounds Per Game
40.8
1.6
Assist To Turnover Ratio
1.5
23.7
Fouls Per Game
22.4
18
Games Played
16
0
Games Started
0
0
Minutes
0
0.0
Minutes Per Game
0.0
765
Rebounds
652
765
Rebounds
652
Offensive
81.1
Free Throw Percentage
76.9
33.6
3-Point Field Goal Percentage
34.1
39.7
Average Field Goals Made
38.9
87.1
Average Field Goals Attempted
85.8
10.2
Average 3-Point Field Goals Made
12.2
30.2
Average 3-Point Field Goals Attempted
35.8
24.8
Average Free Throws Made
16.9
30.6
Average Free Throws Attempted
21.9
114.3
Points Per Game
106.8
11.4
Offensive Rebounds Per Game
10.4
23.4
Assists Per Game
25.0
14.9
Turnovers Per Game
16.2
51.9
2-Point Field Goal Percentage
53.3
1.312
Scoring Efficiency
1.245
0.51
Shooting Efficiency
0.52
45.5
Field Goal Percentage
45.3
531.0
2-Point Field Goals Made
427.0
1024.0
2-Point Field Goals Attempted
801.0
2057
Points
1709
206
Offensive Rebounds
166
422
Assists
400
269
Turnovers
259
714
Field Goals Made
622
1568
Field Goals Attempted
1373
446
Free Throws Made
270
550
Free Throws Attempted
351
183
3-Point Field Goals Made
195
544
3-Point Field Goals Attempted
572
33.6
3-Point Field Goal Percentage
34.1
29.5
2-Point Field Goals Made per Game
26.7
56.9
2-Point Field Goals Attempted per Game
50.1
Defensive
31.1
Defensive Rebounds Per Game
30.4
4.8
Blocks Per Game
3.6
9.3
Steals Per Game
7.5
559
Defensive Rebounds
486
168
Steals
120
87
Blocks
57