

Raptors vs Magic Live Score (27 Dec, 2026)
Game Information
League
NBA
Season
1
Date
December 26, 2026
Tipoff
7:00 PM EST
Status
Scheduled
Team Stats
 TOR
Game Comparison
ORL
-Points-
-Rebounds-
-Assists-
45Field Goal %46
-3-Point %-
-Free Throw %-
Game Leaders
TORORL
 —#
Points
—
—#
—#
Rebounds
—
—#
—#
Assists
—
—#
Injury Report
H2H / Season Series
Last 5 Games



NBA Standings
Eastern Conference — Atlantic
| Team | W | L | PCT | GB | STRK |
|---|---|---|---|---|---|
 Philadelphia | 13 | 3 | .813 | - | W4 |
 Boston | 11 | 4 | .733 | 1.5 | L2 |
 New York | 9 | 6 | .600 | 3.5 | W3 |
| Toronto | 5 | 10 | .333 | 7.5 | L6 |
 Brooklyn | 3 | 11 | .214 | 9 | L3 |
Eastern Conference — Southeast
| Team | W | L | PCT | GB | STRK |
|---|---|---|---|---|---|
 Miami | 9 | 6 | .600 | - | W6 |
 Atlanta | 9 | 6 | .600 | - | W2 |
| Orlando | 6 | 8 | .429 | 2.5 | L1 |
 Washington | 5 | 11 | .313 | 4.5 | W1 |
 Charlotte | 4 | 10 | .286 | 4.5 | L3 |
Rosters
Raptors
4th in Atlantic Division
VS
Magic
8th in Eastern Conference Division
Forward
#4

Scottie Barnes
#9
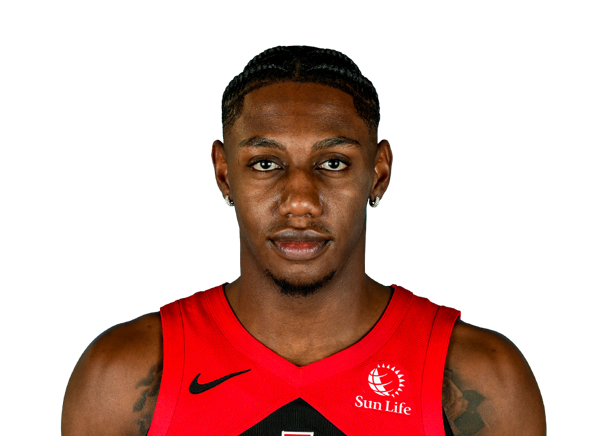
RJ Barrett
#30

Collin Murray-Boyles
#77

Jamison Battle
#22
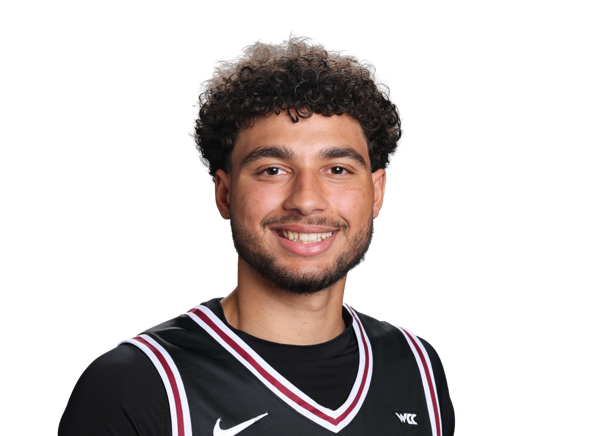
Allen Graves
#32
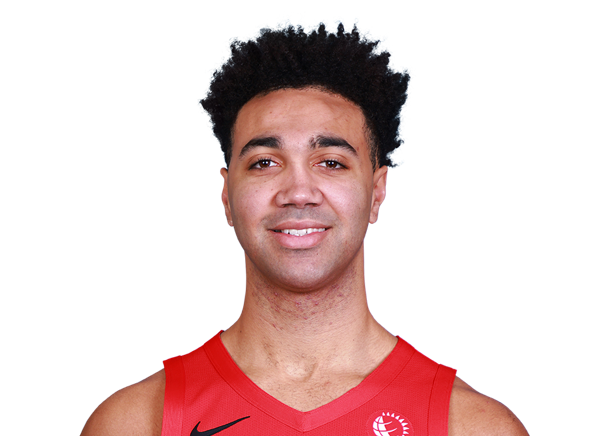
Trayce Jackson-Davis
#12

Kyle Anderson
#2
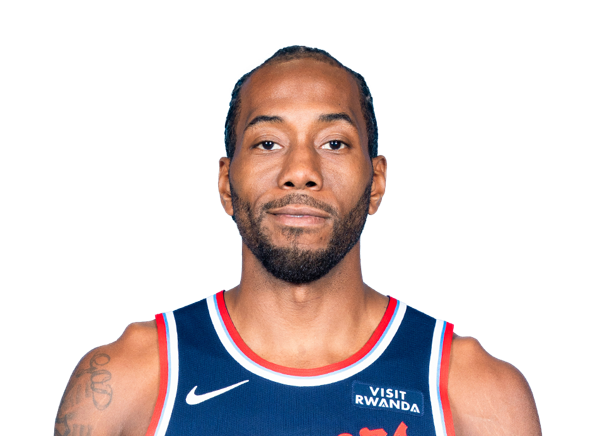
Kawhi Leonard
Guard
#5

Immanuel Quickley
#14
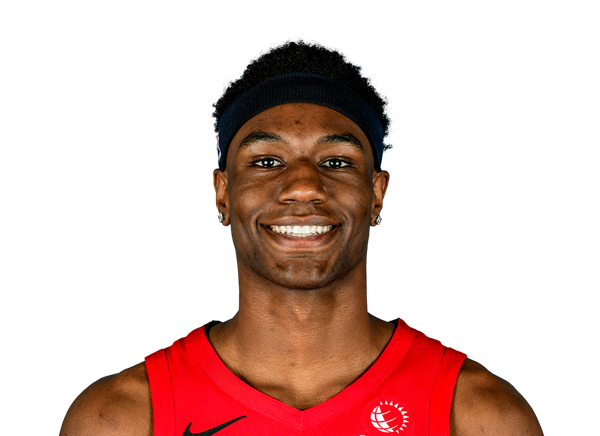
Ja'Kobe Walter
#23

Jamal Shead
#55

Alijah Martin
#8
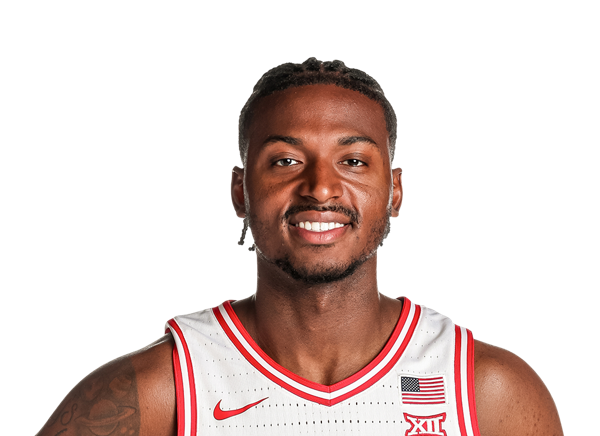
Jaden Bradley
#18
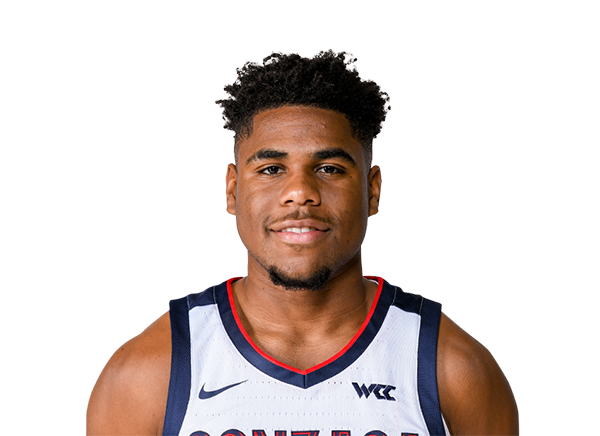
Malachi Smith
Center
#19
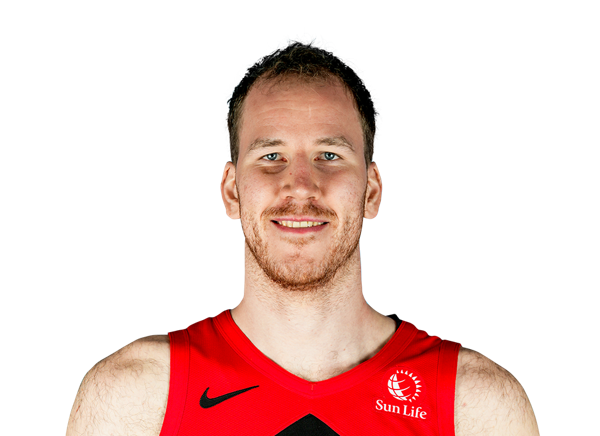
Jakob Poeltl
#12
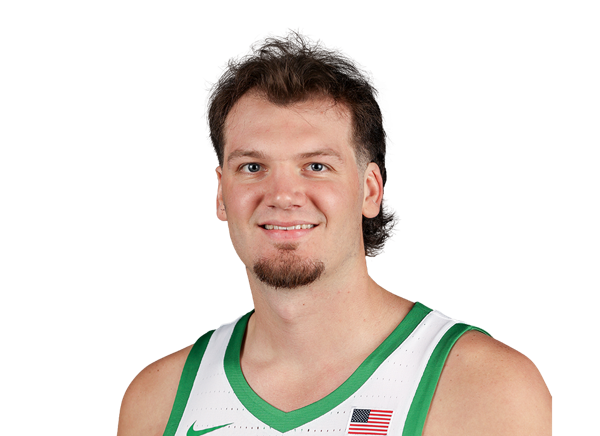
Nate Bittle
Forward
#22

Franz Wagner
#23
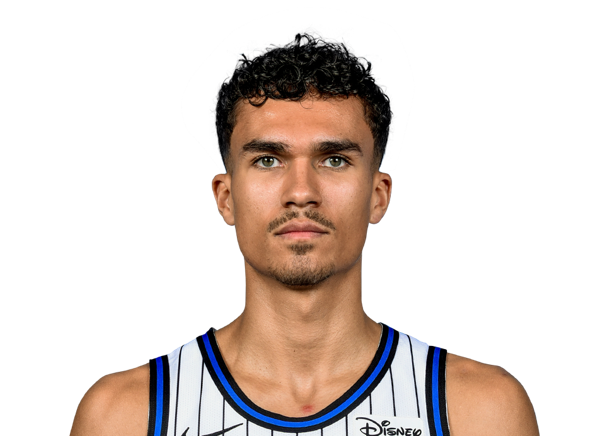
Tristan da Silva
#8

Jamal Cain
#5

Paolo Banchero
#1

Jonathan Isaac
#25
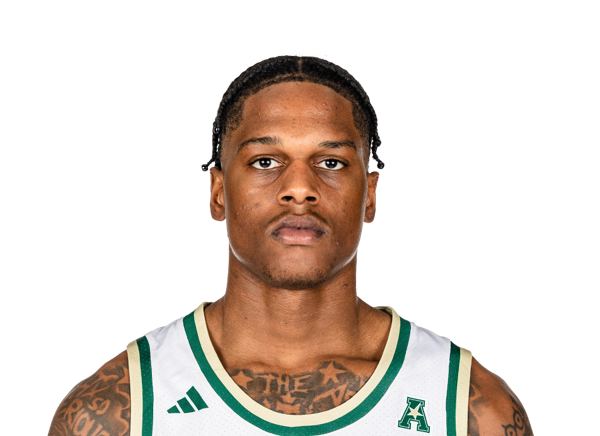
Izaiyah Nelson
#93
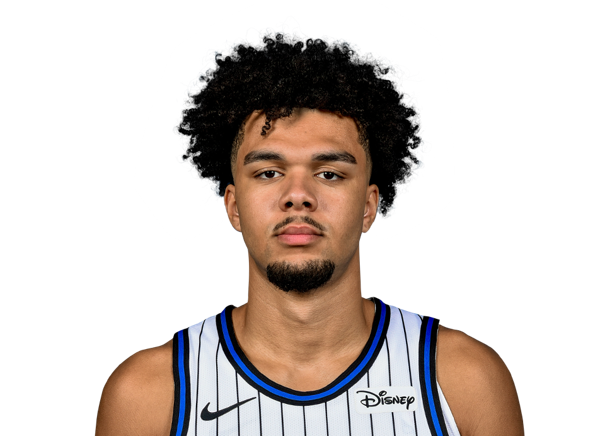
Noah Penda
Guard
#3

Desmond Bane
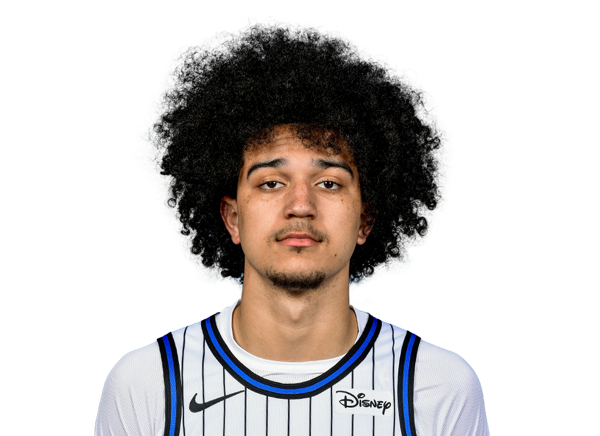
Anthony Black
#11
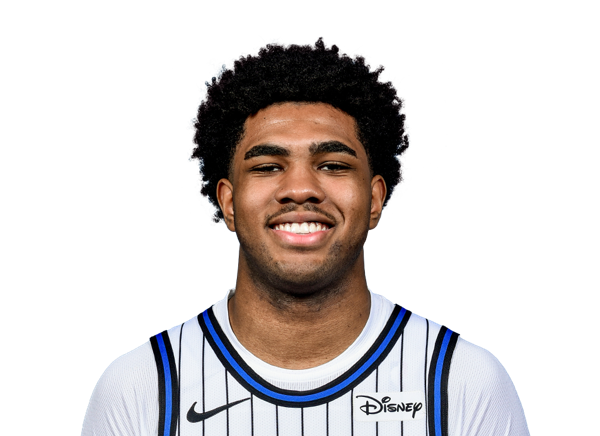
Jase Richardson
#2
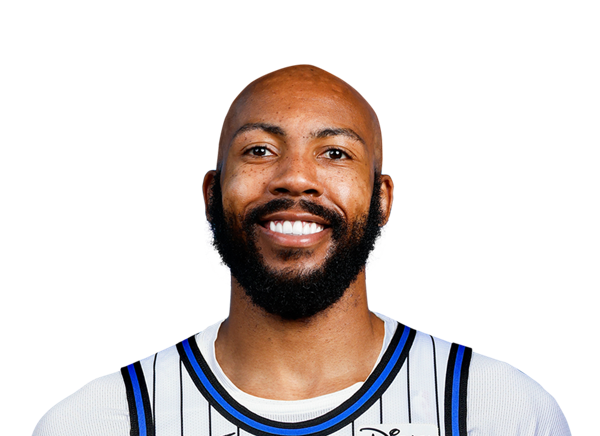
Jevon Carter
#4

Jalen Suggs
#30

Alex Morales
Center
#34
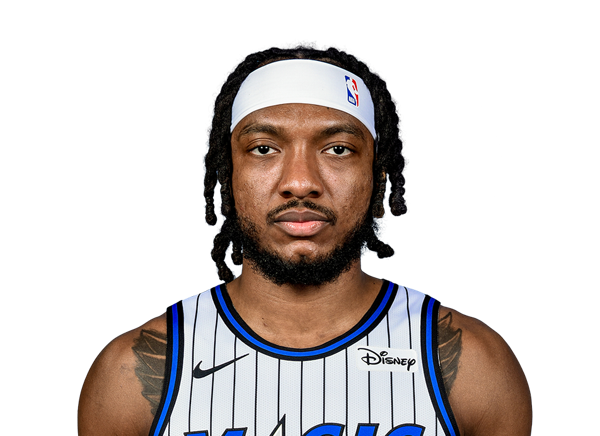
Wendell Carter Jr.
#35

Goga Bitadze
#9

Nikola Vucevic
#14

Colin Castleton
Team Statistics
Raptors
4th in Atlantic Division
VS
Magic
8th in Eastern Conference Division
General
40.6
Rebounds Per Game
42.6
2.2
Assist To Turnover Ratio
1.7
24.8
Fouls Per Game
22.5
16
Games Played
15
0
Games Started
0
0
Minutes
0
0.0
Minutes Per Game
0.0
649
Rebounds
639
649
Rebounds
639
Offensive
71.6
Free Throw Percentage
76.5
33.6
3-Point Field Goal Percentage
35.8
41.3
Average Field Goals Made
39.0
89.9
Average Field Goals Attempted
85.1
11.9
Average 3-Point Field Goals Made
14.5
35.4
Average 3-Point Field Goals Attempted
40.5
17.2
Average Free Throws Made
17.1
24.0
Average Free Throws Attempted
22.4
111.6
Points Per Game
109.6
13.0
Offensive Rebounds Per Game
10.9
27.9
Assists Per Game
26.5
12.8
Turnovers Per Game
15.5
53.8
2-Point Field Goal Percentage
54.9
1.240
Scoring Efficiency
1.287
0.52
Shooting Efficiency
0.54
45.9
Field Goal Percentage
45.8
470.0
2-Point Field Goals Made
368.0
873.0
2-Point Field Goals Attempted
670.0
1785
Points
1644
208
Offensive Rebounds
163
447
Assists
398
204
Turnovers
232
660
Field Goals Made
585
1439
Field Goals Attempted
1277
275
Free Throws Made
257
384
Free Throws Attempted
336
190
3-Point Field Goals Made
217
566
3-Point Field Goals Attempted
607
33.6
3-Point Field Goal Percentage
35.7
29.4
2-Point Field Goals Made per Game
24.5
54.6
2-Point Field Goals Attempted per Game
44.7
Defensive
27.6
Defensive Rebounds Per Game
31.7
4.4
Blocks Per Game
4.3
9.5
Steals Per Game
7.6
441
Defensive Rebounds
476
152
Steals
114
70
Blocks
65