

Rockets vs Grizzlies Live Score (19 Dec, 2026)
Game Information
League
NBA
Season
1
Date
December 18, 2026
Tipoff
8:00 PM EST
Status
Scheduled
Team Stats
 HOU
Game Comparison
MEM
-Points-
-Rebounds-
-Assists-
48Field Goal %48
-3-Point %-
-Free Throw %-
Game Leaders
HOUMEM
 —#
Points
—
—#
—#
Rebounds
—
—#
—#
Assists
—
—#
Injury Report
H2H / Season Series
Last 5 Games







NBA Standings
Western Conference — Southwest
| Team | W | L | PCT | GB | STRK |
|---|---|---|---|---|---|
 San Antonio | 13 | 3 | .813 | - | W1 |
| Houston | 12 | 4 | .750 | 1 | W1 |
| Memphis | 12 | 4 | .750 | 1 | W5 |
 Dallas | 8 | 7 | .533 | 4.5 | W1 |
 New Orleans | 5 | 11 | .313 | 8 | L1 |
Rosters
Rockets
3rd in Western Conference Division
VS
Grizzlies
3rd in Western Conference Division
Center
#28

Alperen Sengun
#9
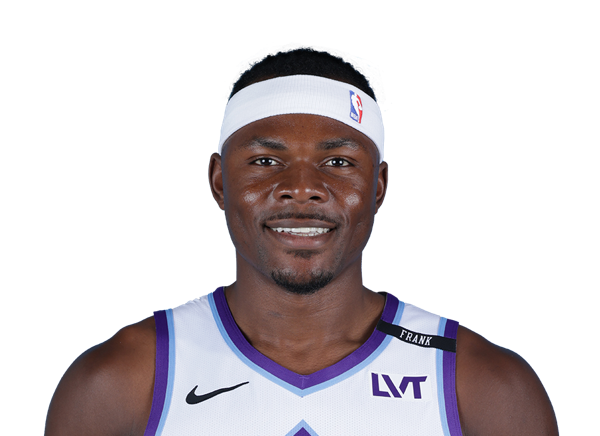
Oscar Tshiebwe
#12

Steven Adams
#30

Clint Capela
Forward
#7

Kevin Durant
#10

Jabari Smith Jr.
#17

Tari Eason
#27

Isaiah Crawford
#8

Jae'Sean Tate
Guard
#1
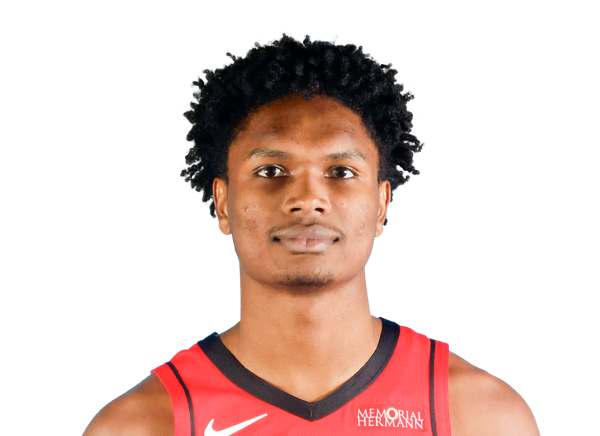
Amen Thompson
#5
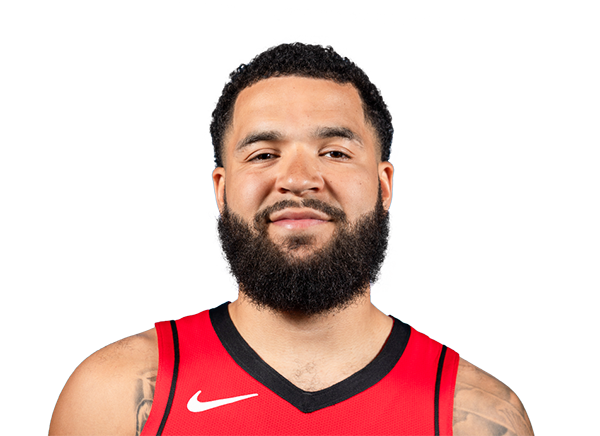
Fred VanVleet
#15
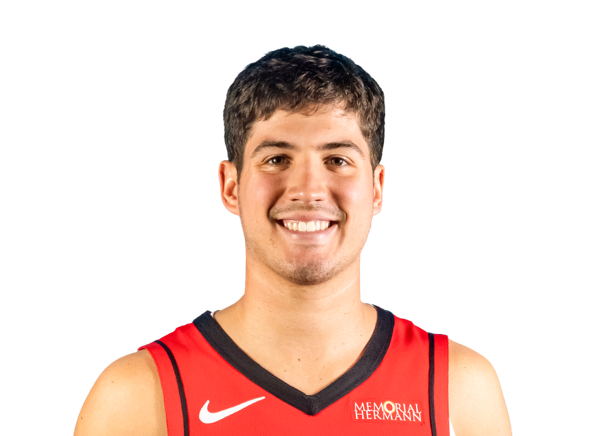
Reed Sheppard
#36
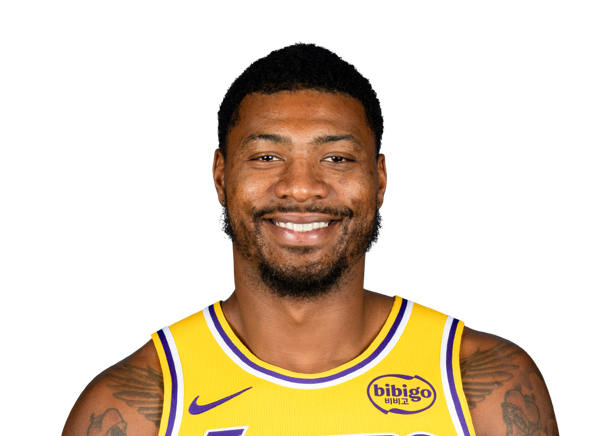
Marcus Smart
#31

Bogdan Bogdanovic
#2
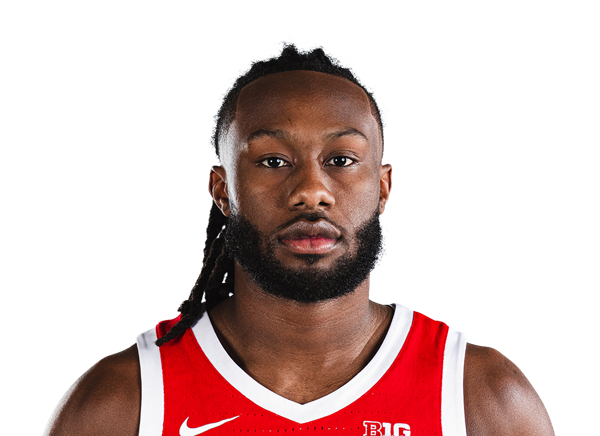
Bruce Thornton
Guard
#2

Ty Jerome
#24

Cam Spencer
#10
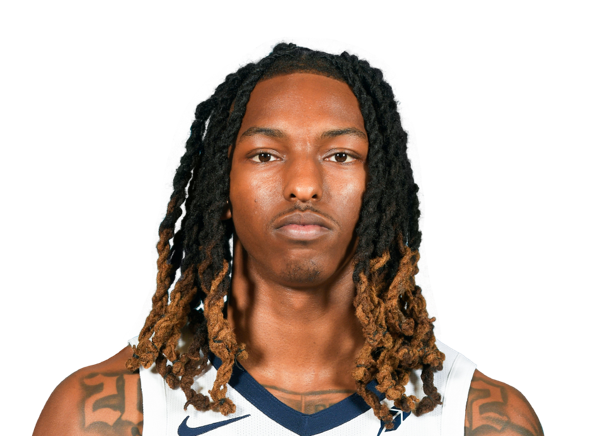
Javon Small
#1
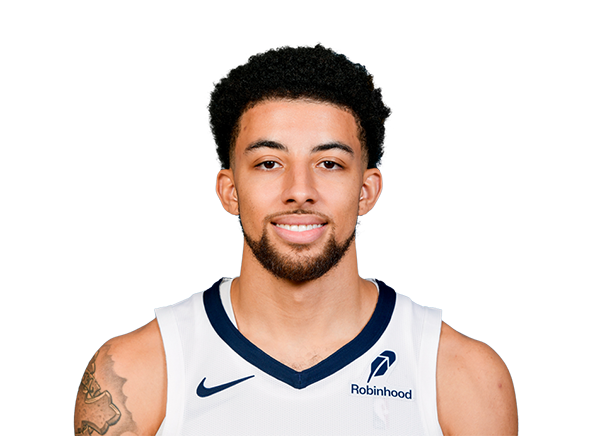
Scotty Pippen Jr.
#21

Jahmai Mashack
#5

Richie Saunders
Forward
#27
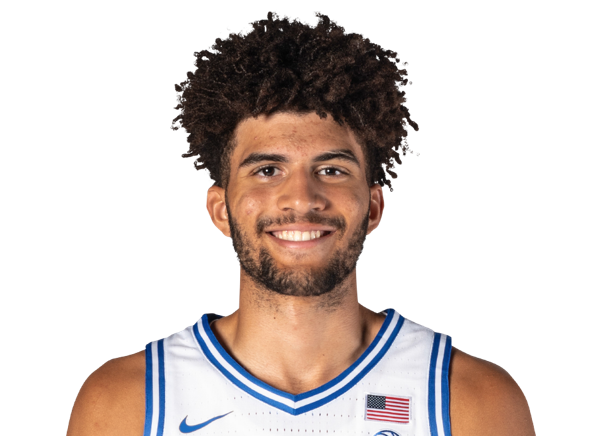
Cameron Boozer
#23
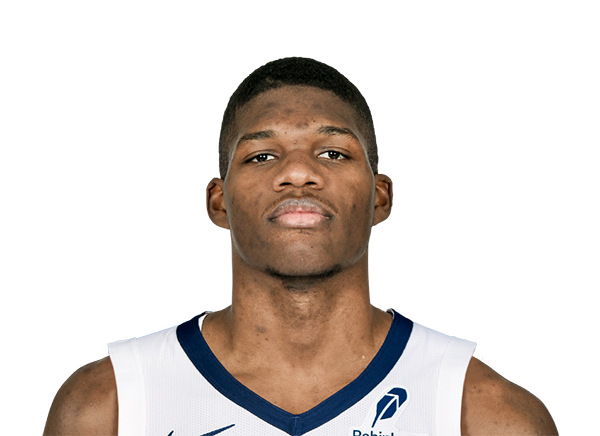
Cedric Coward
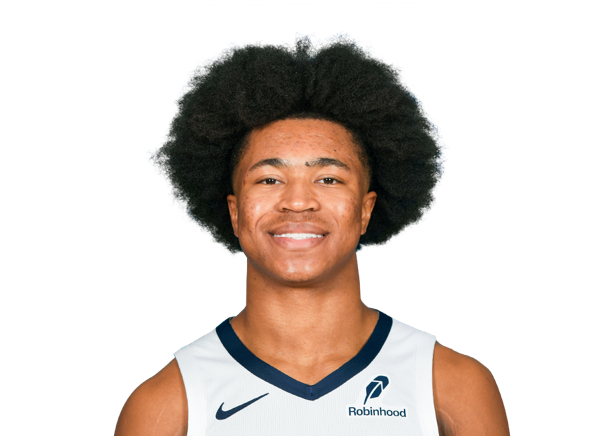
Jaylen Wells
#3

Jerami Grant
#22

Taylor Hendricks
#45
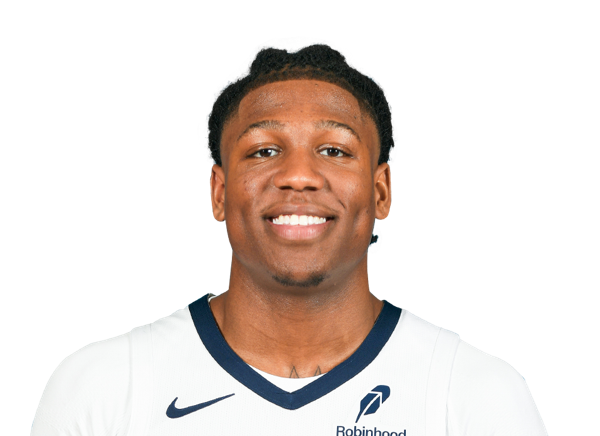
GG Jackson
#18
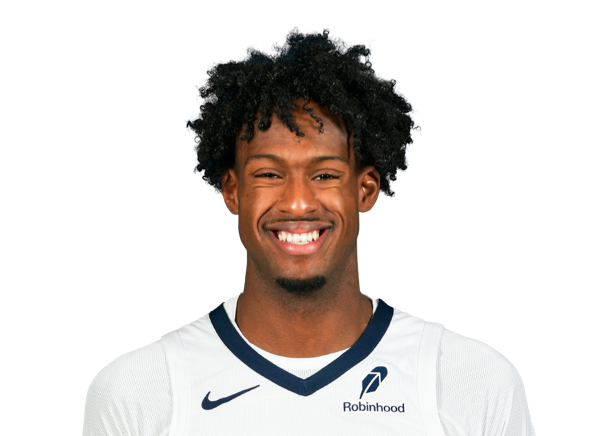
Olivier-Maxence Prosper
#17
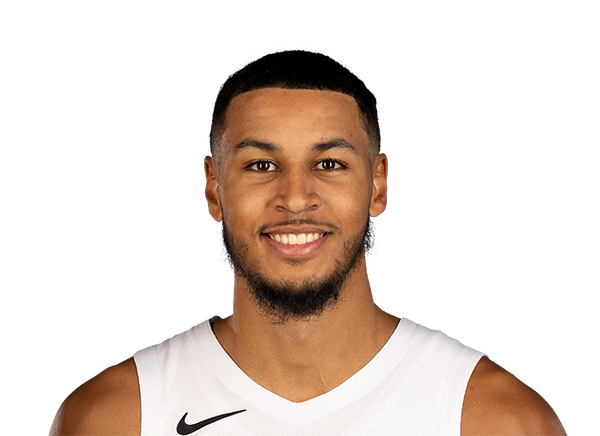
Kris Murray
#35
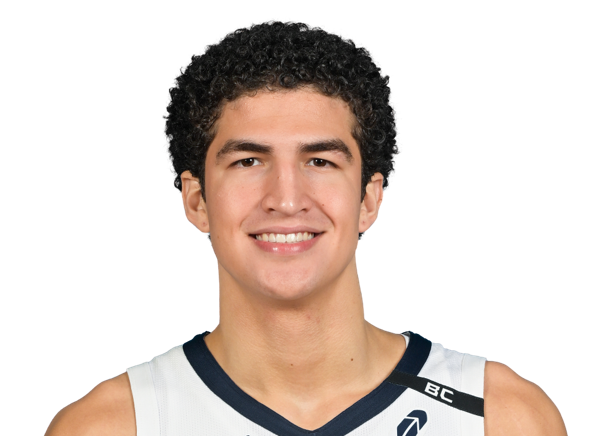
Karim Lopez
Center
#28
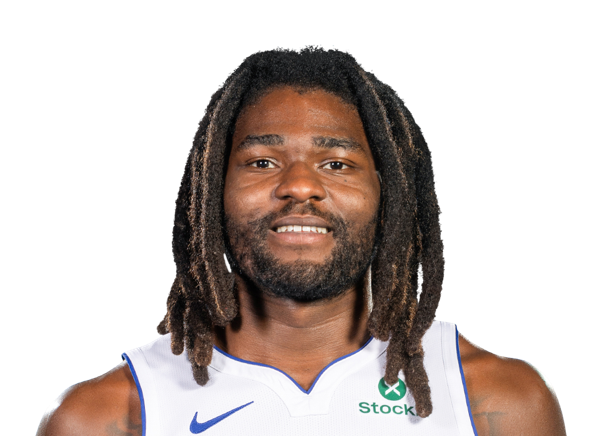
Isaiah Stewart
#14

Zach Edey
#41
Quinten Post

Carson Cooper
Team Statistics
Rockets
3rd in Western Conference Division
VS
Grizzlies
3rd in Western Conference Division
General
45.3
Rebounds Per Game
45.6
2.0
Assist To Turnover Ratio
1.9
20.0
Fouls Per Game
23.1
17
Games Played
17
0
Games Started
0
0
Minutes
0
0.0
Minutes Per Game
0.0
770
Rebounds
775
770
Rebounds
775
Offensive
79.6
Free Throw Percentage
84.5
38.0
3-Point Field Goal Percentage
39.1
42.4
Average Field Goals Made
42.8
87.3
Average Field Goals Attempted
89.1
12.9
Average 3-Point Field Goals Made
15.1
33.9
Average 3-Point Field Goals Attempted
38.7
20.6
Average Free Throws Made
19.9
25.9
Average Free Throws Attempted
23.5
118.2
Points Per Game
120.5
13.6
Offensive Rebounds Per Game
12.4
27.8
Assists Per Game
28.5
13.7
Turnovers Per Game
15.1
55.2
2-Point Field Goal Percentage
54.9
1.354
Scoring Efficiency
1.353
0.56
Shooting Efficiency
0.57
48.5
Field Goal Percentage
48.0
501.0
2-Point Field Goals Made
470.0
907.0
2-Point Field Goals Attempted
856.0
2010
Points
2049
232
Offensive Rebounds
210
472
Assists
485
233
Turnovers
256
720
Field Goals Made
727
1484
Field Goals Attempted
1514
351
Free Throws Made
338
441
Free Throws Attempted
400
219
3-Point Field Goals Made
257
577
3-Point Field Goals Attempted
658
38.0
3-Point Field Goal Percentage
39.1
29.5
2-Point Field Goals Made per Game
27.6
53.4
2-Point Field Goals Attempted per Game
50.4
Defensive
31.6
Defensive Rebounds Per Game
33.2
5.5
Blocks Per Game
4.9
7.5
Steals Per Game
7.2
538
Defensive Rebounds
565
127
Steals
123
93
Blocks
84