

Trail Blazers vs Hornets Live Score (19 Dec, 2026)
Game Information
League
NBA
Season
1
Date
December 19, 2026
Tipoff
6:00 PM EST
Status
Scheduled
Team Stats
 POR
Game Comparison
CHA
-Points-
-Rebounds-
-Assists-
46Field Goal %40
-3-Point %-
-Free Throw %-
Game Leaders
PORCHA
 —#
Points
—
—#
—#
Rebounds
—
—#
—#
Assists
—
—#
Injury Report
Portland Trail Blazers
H2H / Season Series
Last 5 Games







NBA Standings
Western Conference — Northwest
| Team | W | L | PCT | GB | STRK |
|---|---|---|---|---|---|
 Minnesota | 11 | 5 | .688 | - | L1 |
| Portland | 10 | 5 | .667 | 0.5 | W1 |
 Denver | 8 | 5 | .615 | 1.5 | W1 |
 Oklahoma City | 9 | 6 | .600 | 1.5 | L1 |
 Utah | 3 | 13 | .188 | 8 | W2 |
Eastern Conference — Southeast
| Team | W | L | PCT | GB | STRK |
|---|---|---|---|---|---|
 Miami | 9 | 6 | .600 | - | W6 |
 Atlanta | 9 | 6 | .600 | - | W2 |
 Orlando | 6 | 8 | .429 | 2.5 | L1 |
 Washington | 5 | 11 | .313 | 4.5 | W1 |
| Charlotte | 4 | 10 | .286 | 4.5 | L3 |
Rosters
Trail Blazers
6th in Western Conference Division
VS
Hornets
12th in Eastern Conference Division
Forward
#8
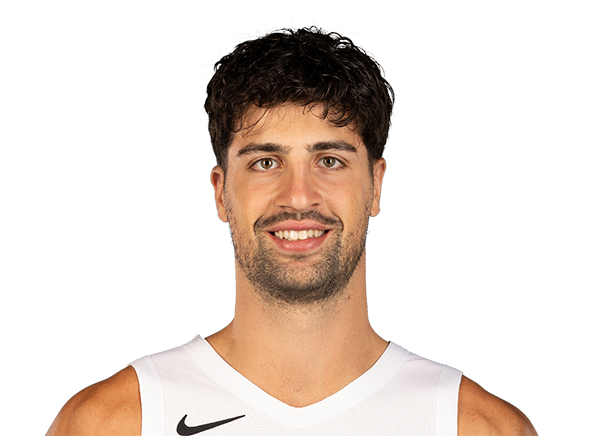
Deni Avdija
#33

Toumani Camara
#2
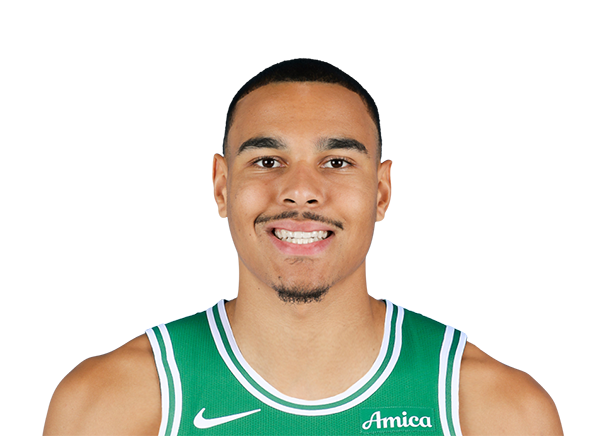
John Tonje
Guard
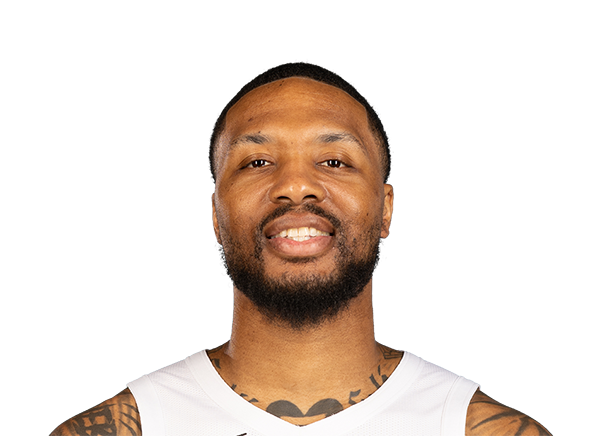
Damian Lillard
#5
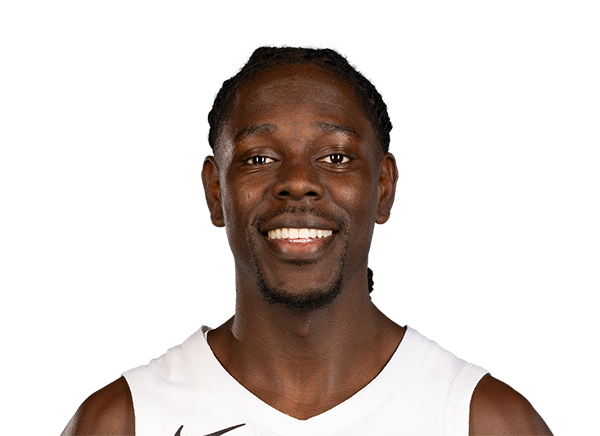
Jrue Holiday
#00
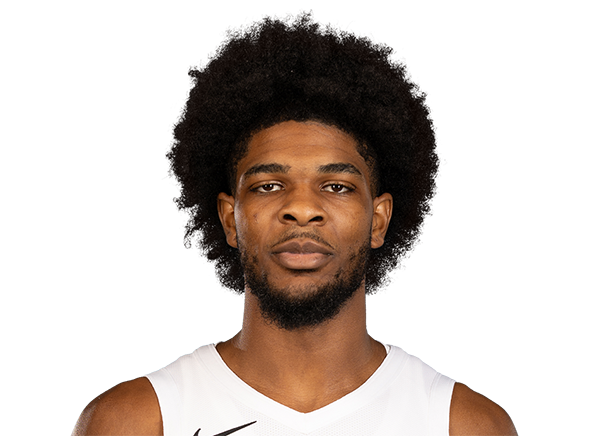
Scoot Henderson
#91
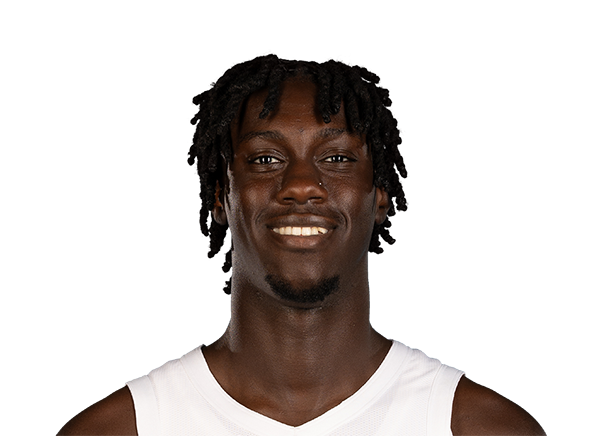
Sidy Cissoko
#1

Ja Morant
#11

Chris Youngblood
#29
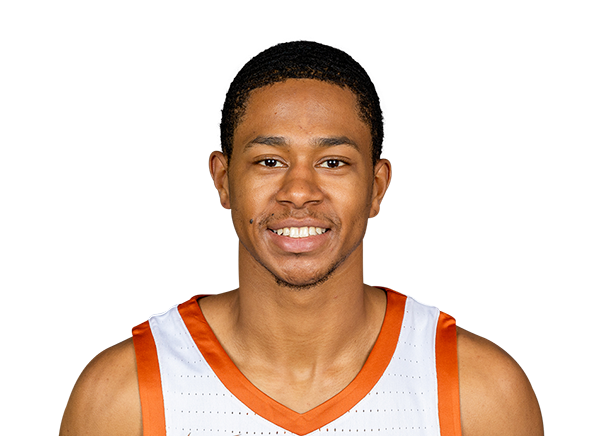
Jayson Kent
#27
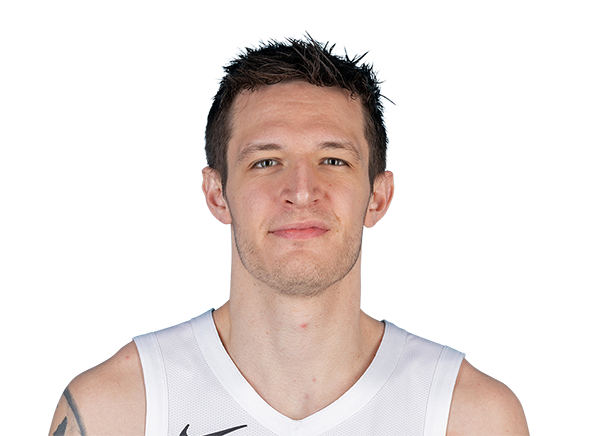
Vit Krejci
#17

Shaedon Sharpe
Center
#23

Donovan Clingan
#35

Robert Williams III
#10

Branden Carlson
#16
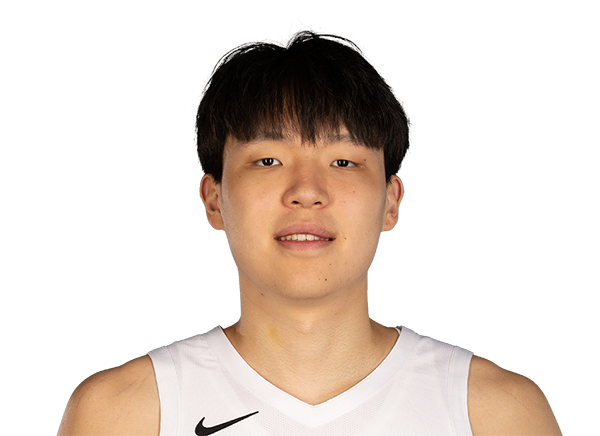
Yang Hansen
#9
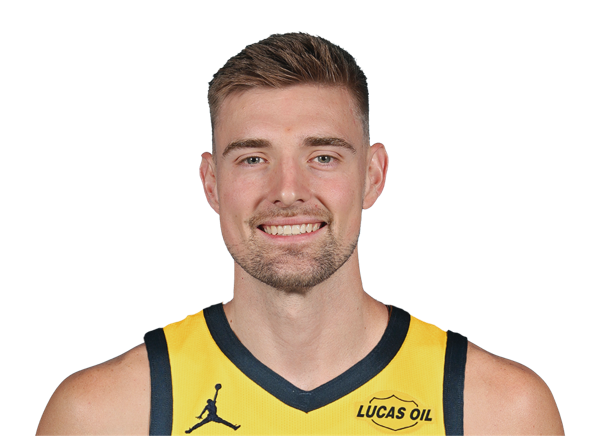
Micah Potter
Forward
#24

Brandon Miller
#14
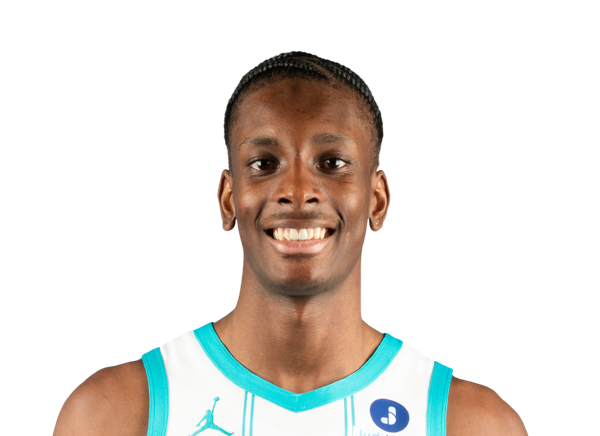
Moussa Diabate
#00

Royce O'Neale
#31

Tidjane Salaun
#2
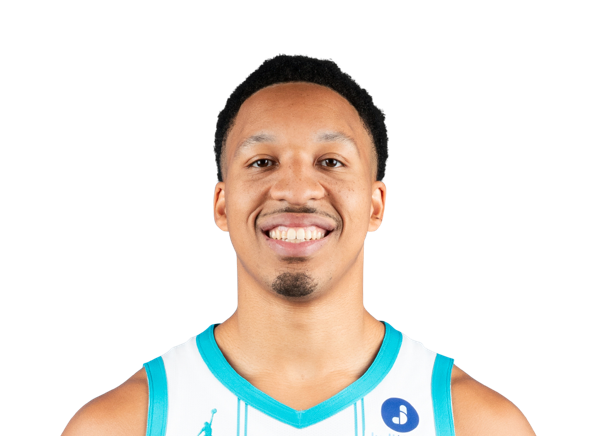
Grant Williams
#22

Hannes Steinbach
Center
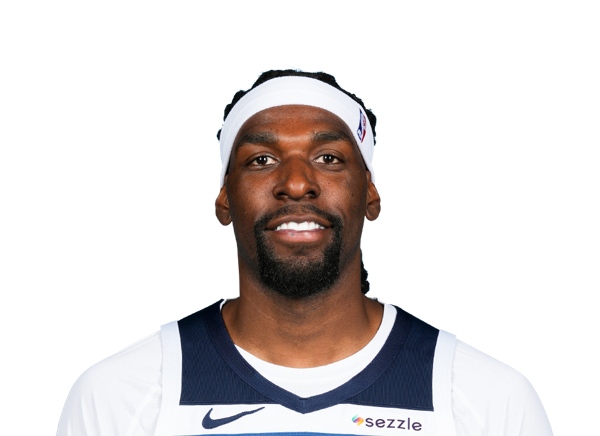
Naz Reid
#11
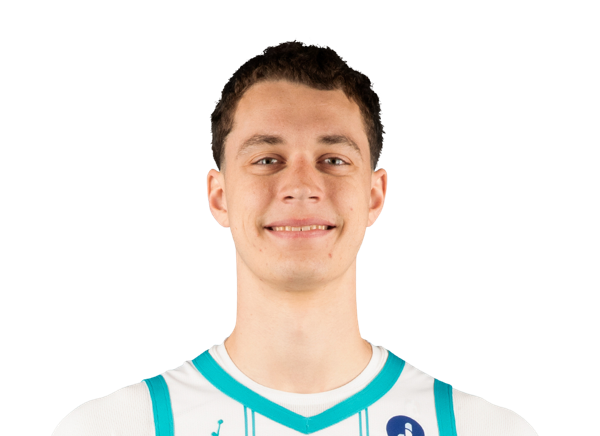
Ryan Kalkbrenner
#16

PJ Hall
Guard
#8

Grayson Allen
#17
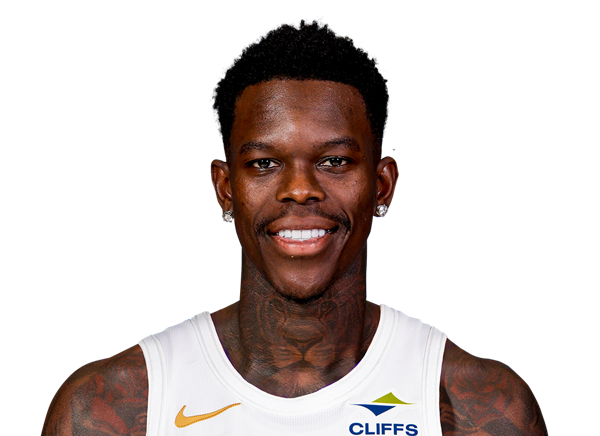
Dennis Schroder
#4

Sion James
#5
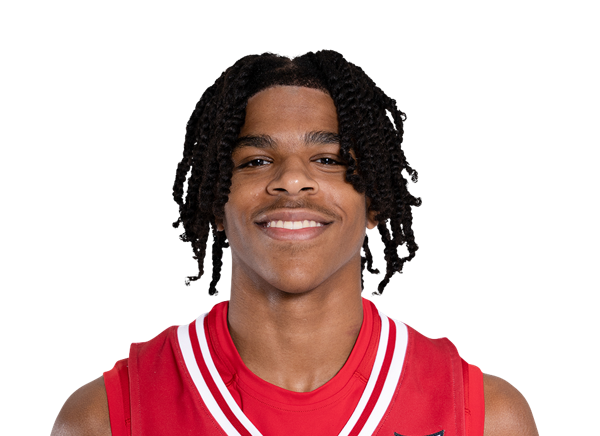
Christian Anderson
#33

Liam McNeeley
#3

Coby White
#7

Kon Knueppel
Team Statistics
Trail Blazers
6th in Western Conference Division
VS
Hornets
12th in Eastern Conference Division
General
44.9
Rebounds Per Game
47.0
1.6
Assist To Turnover Ratio
1.2
22.1
Fouls Per Game
21.0
16
Games Played
15
0
Games Started
0
0
Minutes
0
0.0
Minutes Per Game
0.0
718
Rebounds
705
718
Rebounds
705
Offensive
78.1
Free Throw Percentage
81.4
35.8
3-Point Field Goal Percentage
31.0
39.3
Average Field Goals Made
35.3
85.6
Average Field Goals Attempted
87.5
15.4
Average 3-Point Field Goals Made
14.1
43.1
Average 3-Point Field Goals Attempted
45.4
22.1
Average Free Throws Made
15.2
28.3
Average Free Throws Attempted
18.7
116.1
Points Per Game
99.9
11.7
Offensive Rebounds Per Game
15.3
24.7
Assists Per Game
22.0
15.7
Turnovers Per Game
17.9
56.2
2-Point Field Goal Percentage
50.6
1.357
Scoring Efficiency
1.143
0.55
Shooting Efficiency
0.48
45.9
Field Goal Percentage
40.4
382.0
2-Point Field Goals Made
319.0
680.0
2-Point Field Goals Attempted
631.0
1858
Points
1499
187
Offensive Rebounds
229
395
Assists
330
251
Turnovers
269
629
Field Goals Made
530
1369
Field Goals Attempted
1312
353
Free Throws Made
228
452
Free Throws Attempted
280
247
3-Point Field Goals Made
211
689
3-Point Field Goals Attempted
681
35.8
3-Point Field Goal Percentage
31.0
23.9
2-Point Field Goals Made per Game
21.3
42.5
2-Point Field Goals Attempted per Game
42.1
Defensive
33.2
Defensive Rebounds Per Game
31.7
5.4
Blocks Per Game
4.3
7.3
Steals Per Game
6.9
531
Defensive Rebounds
476
117
Steals
103
86
Blocks
65