

Wizards vs 76ers Live Score (13 Jan, 2027)
Game Information
League
NBA
Season
1
Date
January 12, 2027
Tipoff
8:00 PM EST
Status
Scheduled
Team Stats
 WSH
Game Comparison
PHI

-Points-
-Rebounds-
-Assists-
-Field Goal %-
-3-Point %-
-Free Throw %-
Injury Report
Philadelphia 76ers
H2H / Season Series
Last 5 Games


NBA Standings
Eastern Conference — Southeast
| Team | W | L | PCT | GB | STRK |
|---|---|---|---|---|---|
 Atlanta | 3 | 1 | .750 | - | W3 |
 Miami | 2 | 1 | .667 | 0.5 | L1 |
| Washington | 2 | 1 | .667 | 0.5 | L1 |
 Orlando | 2 | 1 | .667 | 0.5 | W1 |
 Charlotte | 1 | 1 | .500 | 1 | W1 |
Eastern Conference — Atlantic
| Team | W | L | PCT | GB | STRK |
|---|---|---|---|---|---|
 Brooklyn | 3 | 0 | 1.000 | - | W3 |
 Boston | 2 | 0 | 1.000 | 0.5 | W2 |
 Toronto | 2 | 1 | .667 | 1 | W2 |
| Philadelphia | 1 | 2 | .333 | 2 | L2 |
 New York | 0 | 4 | .000 | 3.5 | L4 |
Rosters
Wizards
5th in Eastern Conference Division
VS
76ers
1st in Atlantic Division
Forward
#23

Anthony Davis
#18
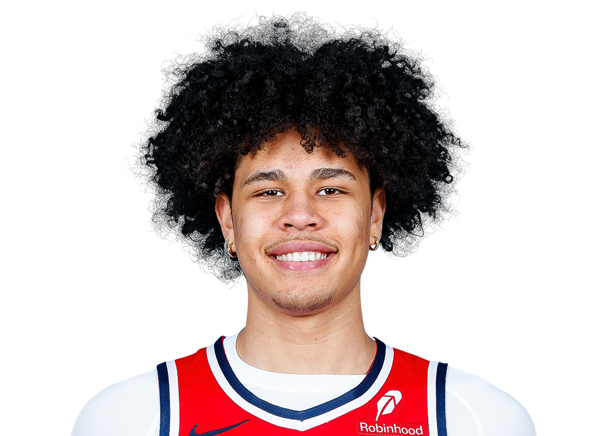
Kyshawn George
#22

Khris Middleton
#4

AJ Dybantsa
#9
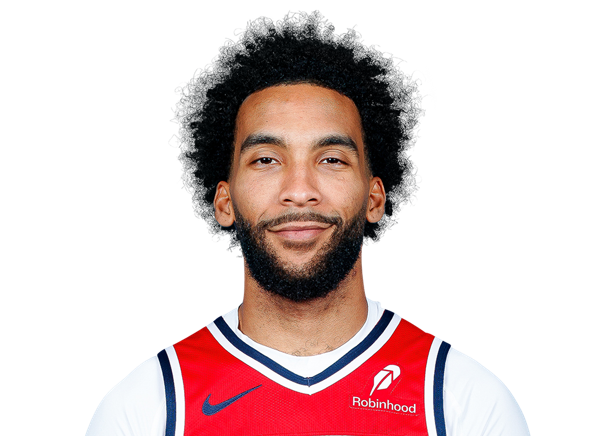
Justin Champagnie
#34
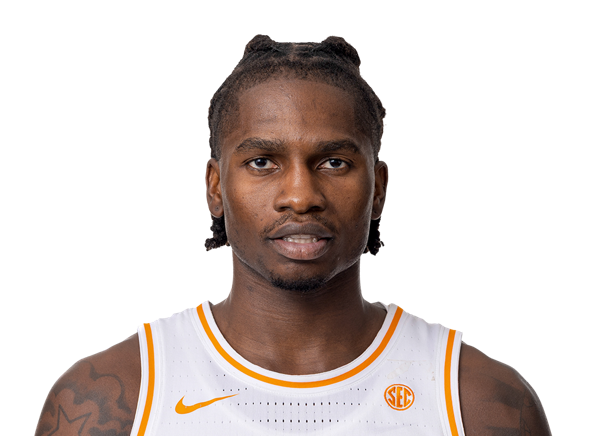
Felix Okpara
#16

Anthony Gill
#00
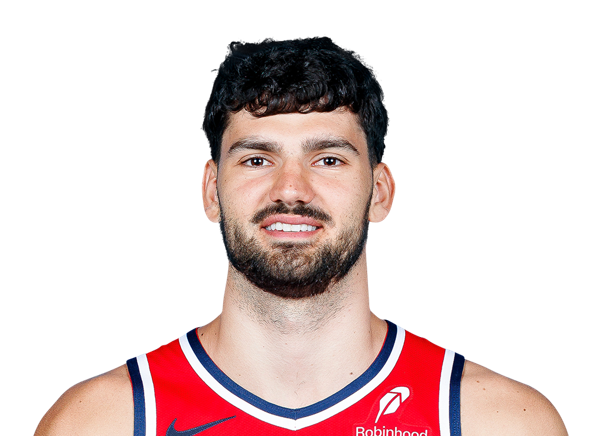
Tristan Vukcevic
Guard
#3

Trae Young
#12
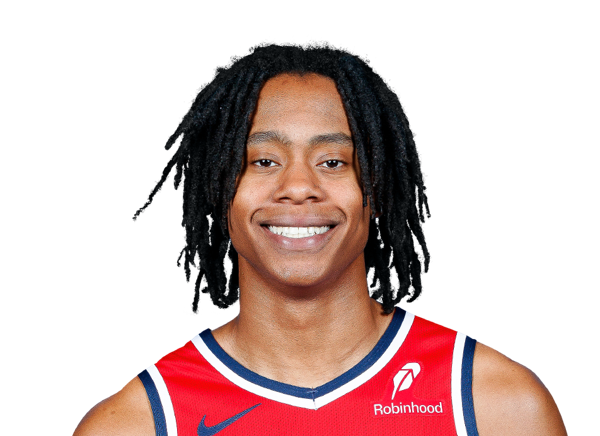
Tre Johnson

Bilal Coulibaly
#7

Bub Carrington
#27
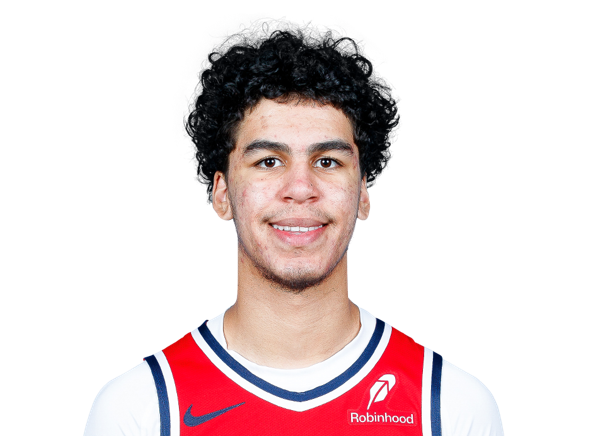
Will Riley
#1
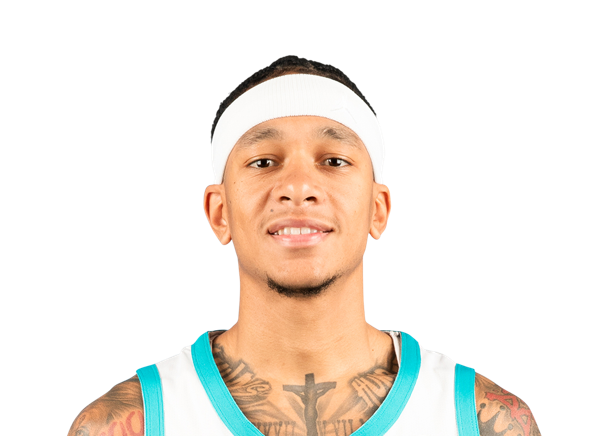
Tre Mann
#26
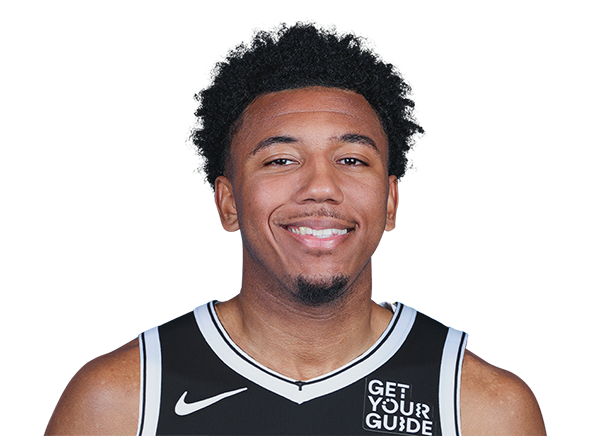
Reece Beekman
#5
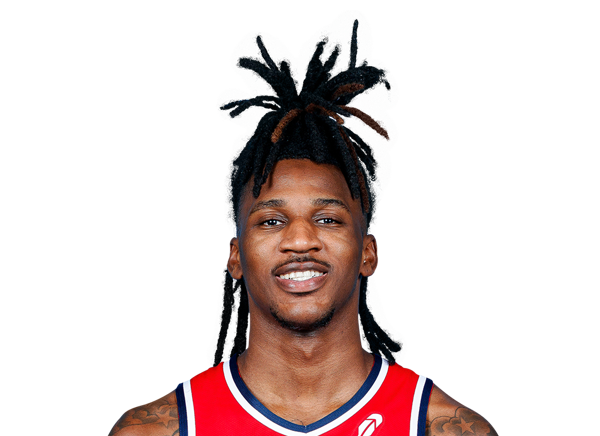
Jamir Watkins
Center
#20

Alex Sarr
#8
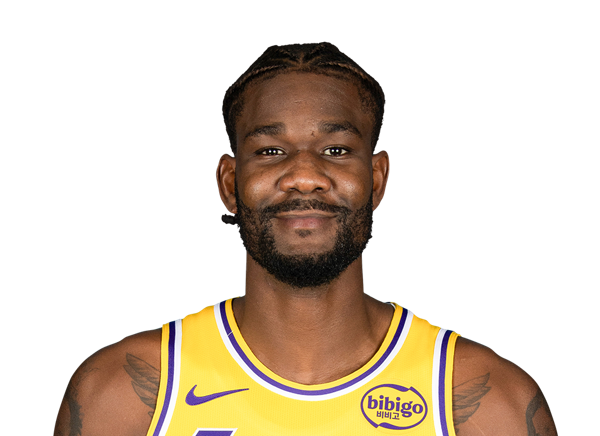
Deandre Ayton
Guard
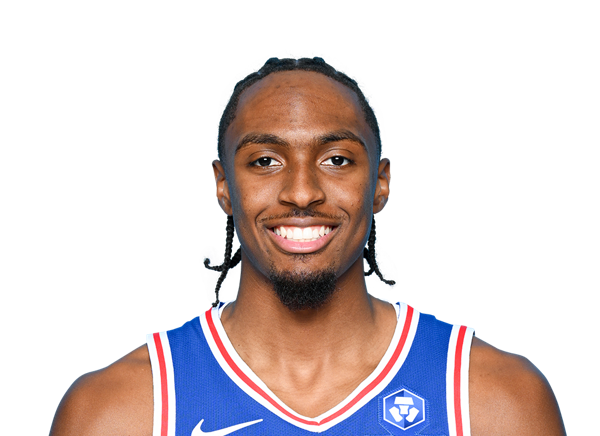
Tyrese Maxey
#7

Jaylen Brown
#77
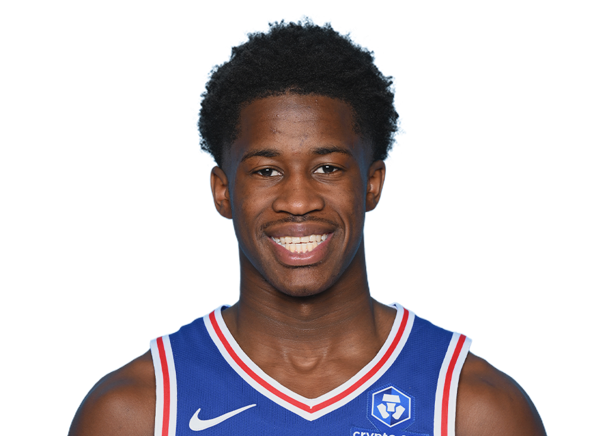
VJ Edgecombe
#5
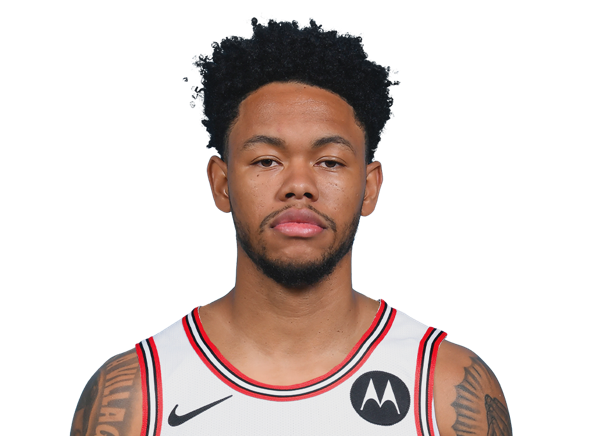
Anfernee Simons
#1

Kentavious Caldwell-Pope
#00

Labaron Philon Jr.
#12

Rayan Rupert
#8

Caleb Love
Center
#21
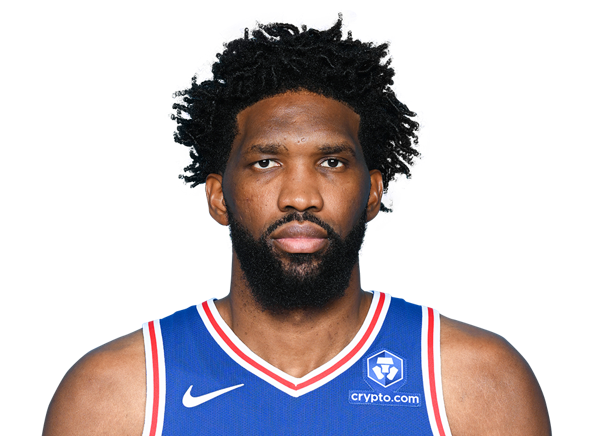
Joel Embiid
#30

Adem Bona
#55

Ariel Hukporti
Forward
#23
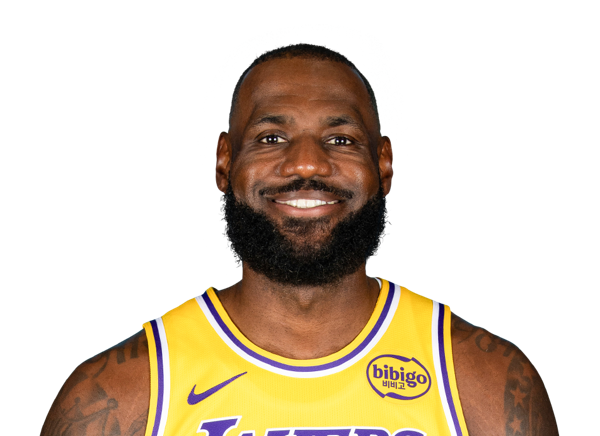
LeBron James
#45

Dean Wade
#33
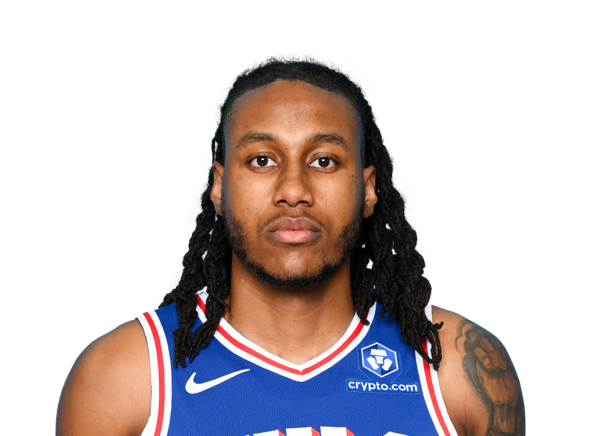
Jabari Walker
#11
Justin Edwards
#25

Dominick Barlow
Team Statistics
Wizards
5th in Eastern Conference Division
VS
76ers
1st in Atlantic Division
General
41.0
Rebounds Per Game
42.3
1.8
Assist To Turnover Ratio
2.1
20.4
Fouls Per Game
21.9
8
Games Played
9
0
Games Started
0
0
Minutes
0
0.0
Minutes Per Game
0.0
328
Rebounds
381
328
Rebounds
381
Offensive
81.4
Free Throw Percentage
76.7
29.4
3-Point Field Goal Percentage
34.4
39.4
Average Field Goals Made
39.9
82.8
Average Field Goals Attempted
88.2
8.8
Average 3-Point Field Goals Made
11.4
29.8
Average 3-Point Field Goals Attempted
33.2
21.4
Average Free Throws Made
19.8
26.3
Average Free Throws Attempted
25.8
108.9
Points Per Game
111.0
8.4
Offensive Rebounds Per Game
9.4
24.8
Assists Per Game
26.1
13.5
Turnovers Per Game
12.3
57.8
2-Point Field Goal Percentage
51.7
1.316
Scoring Efficiency
1.258
0.53
Shooting Efficiency
0.52
47.6
Field Goal Percentage
45.2
245.0
2-Point Field Goals Made
256.0
424.0
2-Point Field Goals Attempted
495.0
871
Points
999
67
Offensive Rebounds
85
198
Assists
235
108
Turnovers
111
315
Field Goals Made
359
662
Field Goals Attempted
794
171
Free Throws Made
178
210
Free Throws Attempted
232
70
3-Point Field Goals Made
103
238
3-Point Field Goals Attempted
299
29.4
3-Point Field Goal Percentage
34.4
30.6
2-Point Field Goals Made per Game
28.4
53.0
2-Point Field Goals Attempted per Game
55.0
Defensive
32.6
Defensive Rebounds Per Game
32.9
5.8
Blocks Per Game
4.7
7.6
Steals Per Game
8.9
261
Defensive Rebounds
296
61
Steals
80
46
Blocks
42