

Wizards vs Clippers Live Score (23 Jan, 2027)
Game Information
League
NBA
Season
1
Date
January 22, 2027
Tipoff
10:30 PM EST
Status
Scheduled
Team Stats
 WSH
Game Comparison
LAC

-Points-
-Rebounds-
-Assists-
45Field Goal %51
-3-Point %-
-Free Throw %-
Game Leaders
WSHLAC
 —#
Points
—
—#
—#Rebounds
—
—#
—#Assists
—
—#
Injury Report
H2H / Season Series
Last 5 Games






NBA Standings
Eastern Conference — Southeast
| Team | W | L | PCT | GB | STRK |
|---|---|---|---|---|---|
 Atlanta | 2 | 0 | 1.000 | - | W2 |
| Washington | 1 | 1 | .500 | 1 | L1 |
 Charlotte | 1 | 1 | .500 | 1 | L1 |
 Orlando | 0 | 2 | .000 | 2 | L2 |
 Miami | 0 | 2 | .000 | 2 | L2 |
Western Conference — Pacific
| Team | W | L | PCT | GB | STRK |
|---|---|---|---|---|---|
 LA Lakers | 2 | 0 | 1.000 | - | W2 |
| LA Clippers | 1 | 1 | .500 | 1 | L1 |
 Phoenix | 0 | 1 | .000 | 1.5 | L1 |
 Golden State | 0 | 2 | .000 | 2 | L2 |
 Sacramento | 0 | 2 | .000 | 2 | L2 |
Rosters
Wizards
5th in Eastern Conference Division
VS
Clippers
4th in Pacific Division
Forward
#23

Anthony Davis
#18
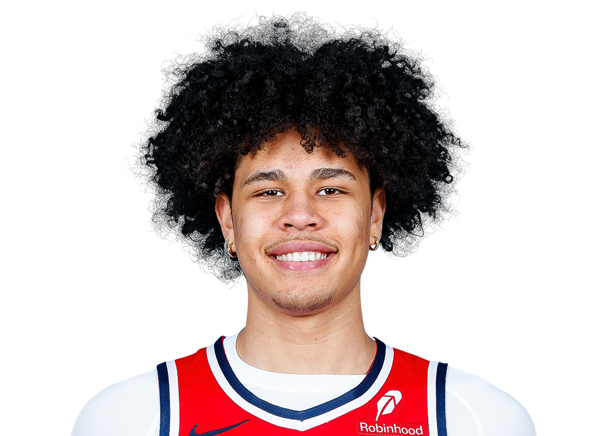
Kyshawn George
#22

Khris Middleton
#4

AJ Dybantsa
#9
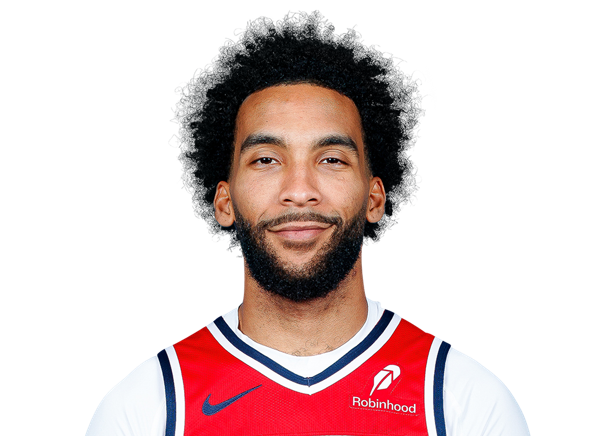
Justin Champagnie
#34
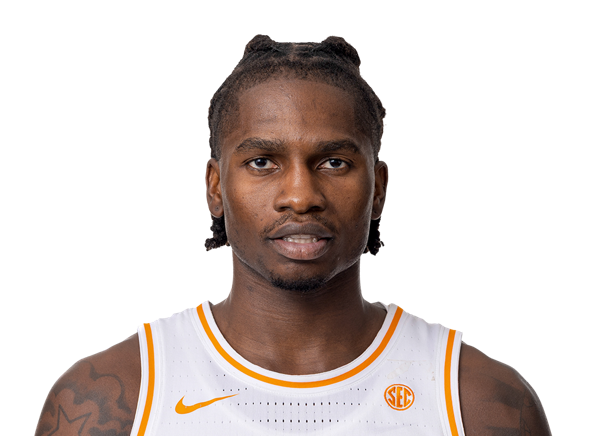
Felix Okpara
#16

Anthony Gill
#00
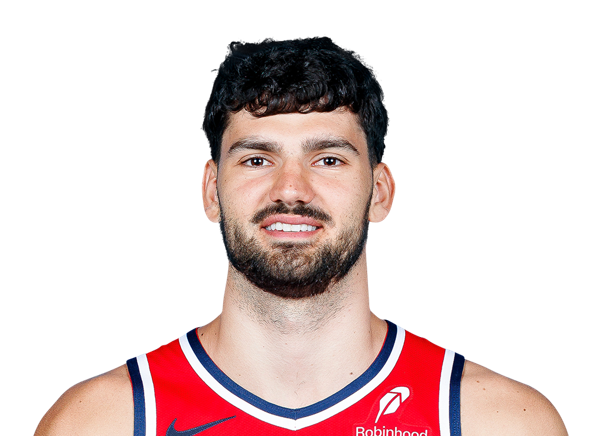
Tristan Vukcevic
Guard
#3

Trae Young
#12
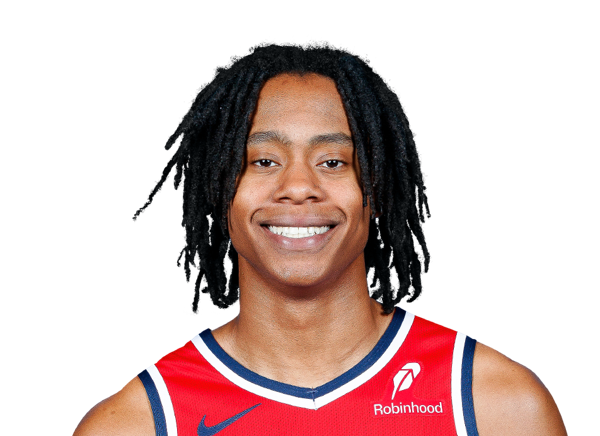
Tre Johnson

Bilal Coulibaly
#7
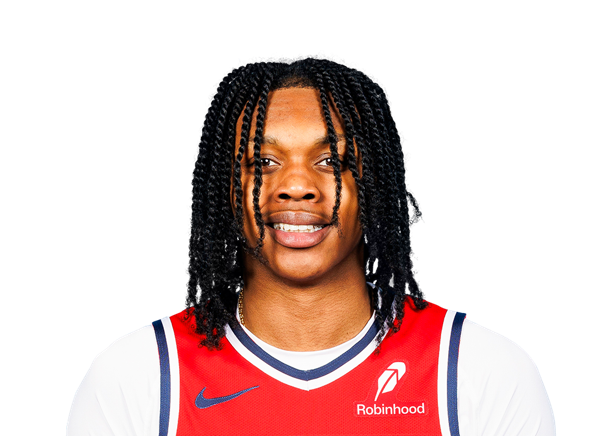
Bub Carrington
#27
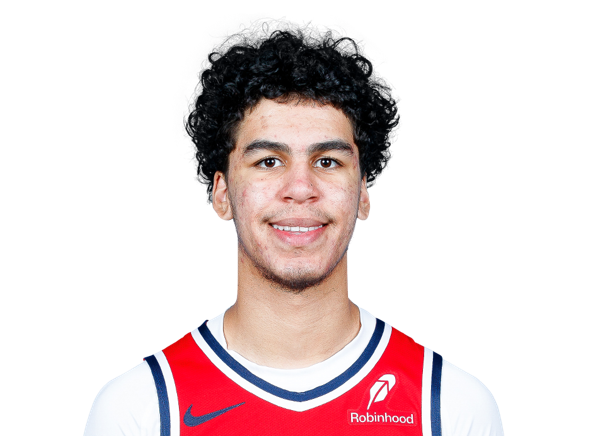
Will Riley
#1
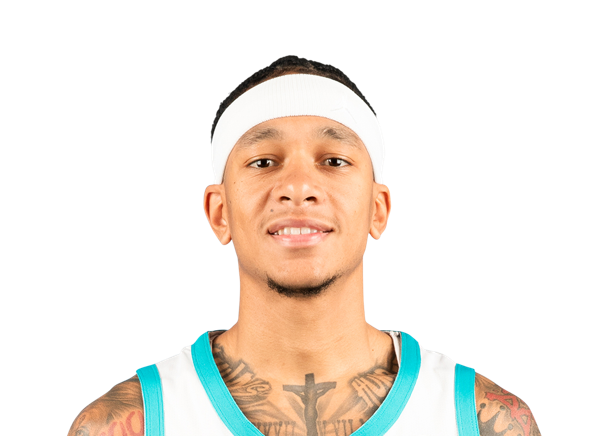
Tre Mann
#26
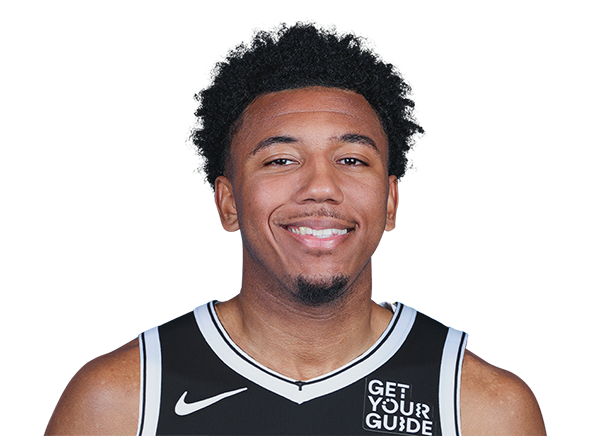
Reece Beekman
#5
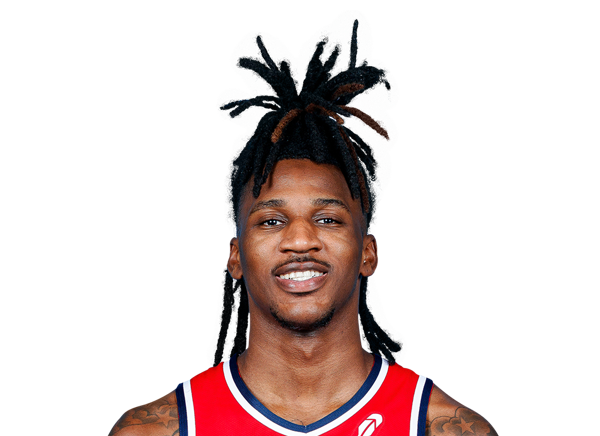
Jamir Watkins
Center
#20

Alex Sarr
#8
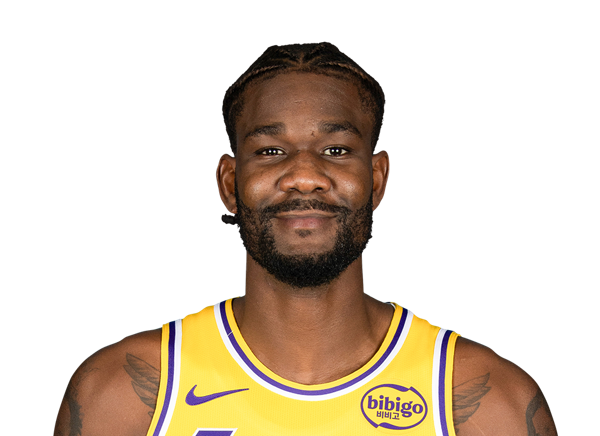
Deandre Ayton
Guard
#10

Darius Garland
#1
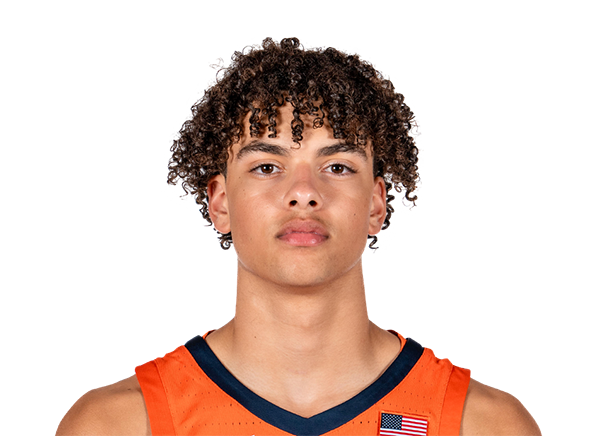
Keaton Wagler
#4
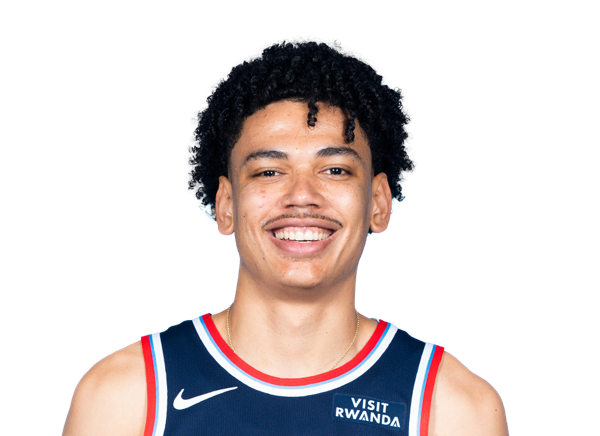
Kobe Sanders
#8

Kris Dunn
#9

Gradey Dick
#31
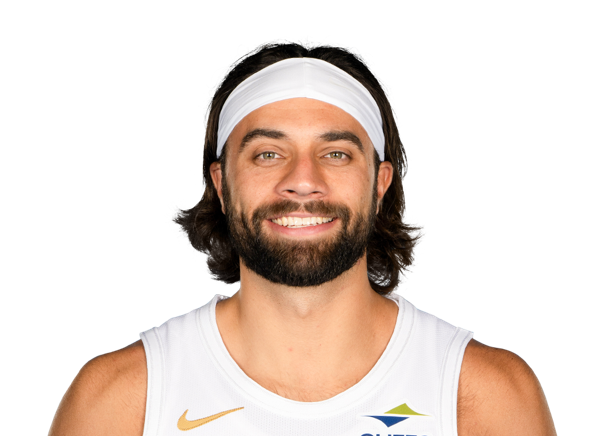
Max Strus
#21
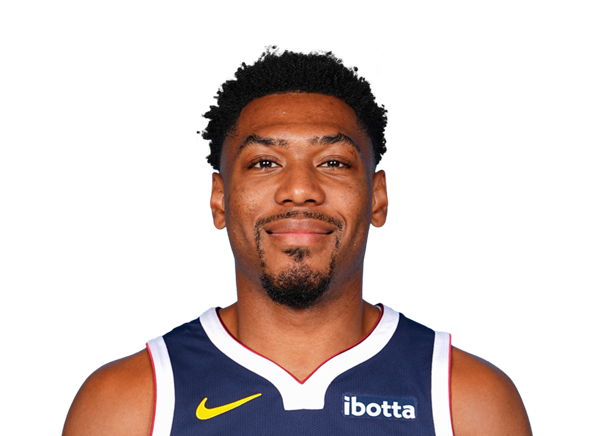
Jalen Pickett
#24

Cam Christie
#20

Blake Wesley
#3
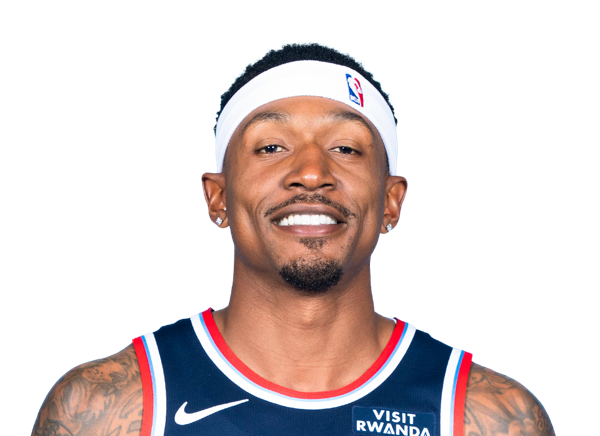
Bradley Beal
#22
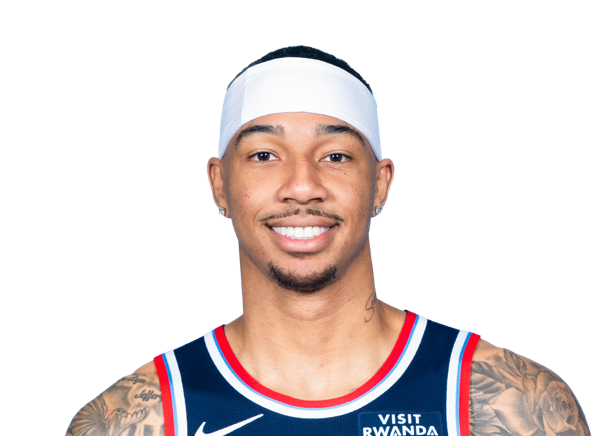
Jordan Miller
Forward
#28
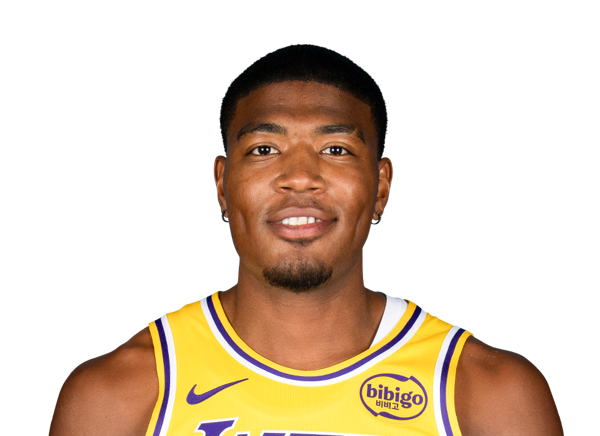
Rui Hachimura
#5
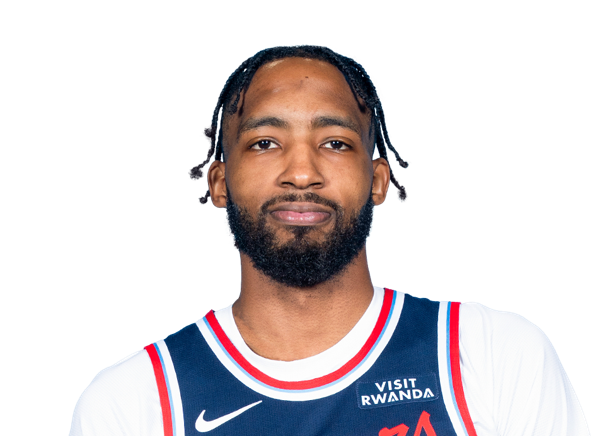
Derrick Jones Jr.
#23
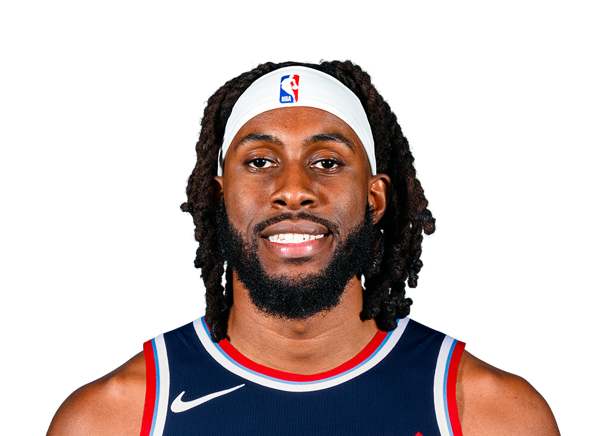
Isaiah Jackson
#18
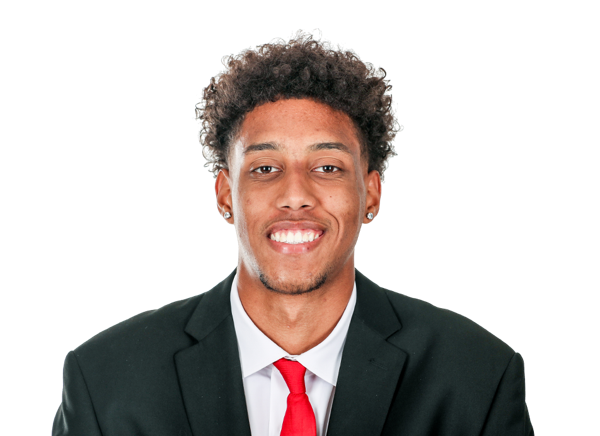
Baba Miller
#12
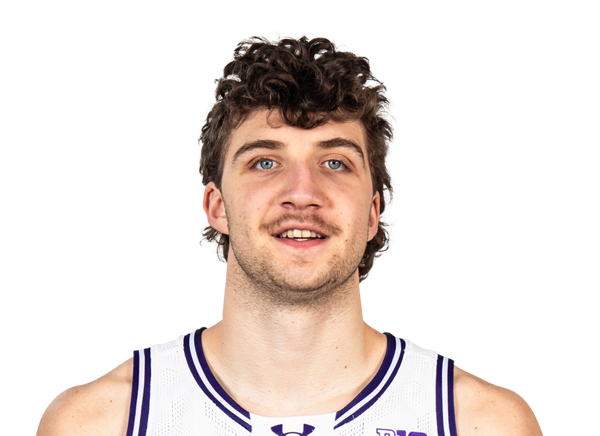
Nick Martinelli
#7
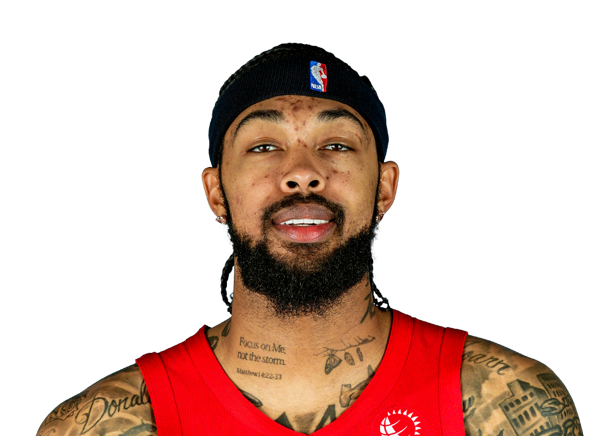
Brandon Ingram
Center
#11
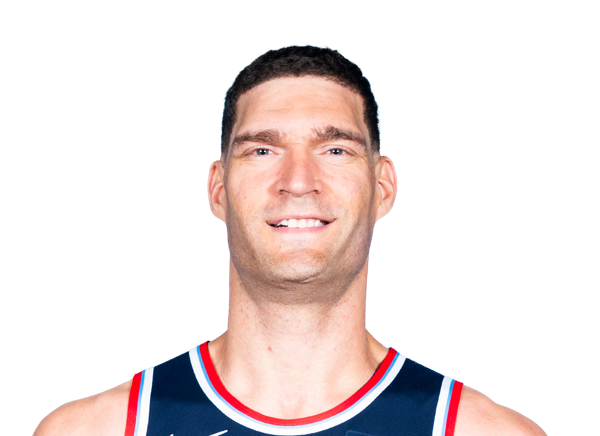
Brook Lopez
#14
Yanic Konan Niederhauser
Team Statistics
Wizards
5th in Eastern Conference Division
VS
Clippers
4th in Pacific Division
General
41.0
Rebounds Per Game
41.5
1.8
Assist To Turnover Ratio
1.3
20.4
Fouls Per Game
22.6
8
Games Played
8
0
Games Started
0
0
Minutes
0
0.0
Minutes Per Game
0.0
328
Rebounds
332
328
Rebounds
332
Offensive
81.4
Free Throw Percentage
80.1
29.4
3-Point Field Goal Percentage
38.2
39.4
Average Field Goals Made
38.4
82.8
Average Field Goals Attempted
84.6
8.8
Average 3-Point Field Goals Made
13.8
29.8
Average 3-Point Field Goals Attempted
36.0
21.4
Average Free Throws Made
18.6
26.3
Average Free Throws Attempted
23.3
108.9
Points Per Game
109.1
8.4
Offensive Rebounds Per Game
10.4
24.8
Assists Per Game
25.6
13.5
Turnovers Per Game
19.4
57.8
2-Point Field Goal Percentage
50.6
1.316
Scoring Efficiency
1.290
0.53
Shooting Efficiency
0.53
47.6
Field Goal Percentage
45.3
245.0
2-Point Field Goals Made
197.0
424.0
2-Point Field Goals Attempted
389.0
871
Points
873
67
Offensive Rebounds
83
198
Assists
205
108
Turnovers
155
315
Field Goals Made
307
662
Field Goals Attempted
677
171
Free Throws Made
149
210
Free Throws Attempted
186
70
3-Point Field Goals Made
110
238
3-Point Field Goals Attempted
288
29.4
3-Point Field Goal Percentage
38.2
30.6
2-Point Field Goals Made per Game
24.6
53.0
2-Point Field Goals Attempted per Game
48.6
Defensive
32.6
Defensive Rebounds Per Game
31.1
5.8
Blocks Per Game
4.5
7.6
Steals Per Game
10.1
261
Defensive Rebounds
249
61
Steals
81
46
Blocks
36