

Flyers vs Maple Leafs Live Score (19 Apr, 2022)
Score by Period
| Team | 1st | 2nd | 3rd | Total |
|---|---|---|---|---|
 PHI | 0 | 1 | 1 | 2 |
 TOR | 0 | 3 | 2 | 5 |
Play-by-Play
3rd Period 20:00
2–5
3rd Period 20:00
2–5
3rd Period 19:45
2–5
3rd Period 19:44
2–5
3rd Period 19:42
2–5
3rd Period 19:36
2–5
3rd Period 19:26
2–5
3rd Period 19:24
2–5
3rd Period 19:02
2–5
3rd Period 18:56
2–5
3rd Period 18:56
2–5
3rd Period 18:56
2–5
3rd Period 18:51
2–5
3rd Period 18:46
2–5
3rd Period 18:27
2–5
3rd Period 18:27
2–5
3rd Period 17:51
2–4
3rd Period 17:51
2–4
3rd Period 17:48
2–4
3rd Period 17:40
2–4
3rd Period 17:24
2–4
3rd Period 17:24
2–4
3rd Period 17:23
1–4
3rd Period 17:20
1–4
Scoring Summary
2nd Period
1:35
Timothy Liljegren
Assists: Alexander Kerfoot, William Nylander
0 - 1
8:07
James van Riemsdyk
Assists: Keith Yandle, Travis Konecny
1 - 1
13:39
William Nylander
Assists: John Tavares, Mitch Marner
1 - 2
19:35
Jason Spezza
Assists: Mark Giordano, Wayne Simmonds
1 - 3
3rd Period
10:11
David Kampf
Assists: Ilya Lyubushkin, Ilya Mikheyev
1 - 4
17:24
Ronnie Attard
Assists: Travis Konecny
2 - 4
18:27
Ilya Mikheyev
Assists: Pierre Engvall, TJ Brodie
2 - 5
Team Stats
PHI
TOR

13
Blocked Shots
8
58
Hits
33
8
Takeaways
10
13
Giveaways
20
0
Power Play Goals
1
3
Power Play Opportunities
5
39
Total Shots
29
15
Penalty Minutes
11
0.0
Power Play %
20.0
0
Short Handed Goals
0
0
Shootout Goals
0
28
Faceoffs Won
32
46.7
Faceoff Percent
53.3
6
Penalties
4
Game Leaders
PHI
TOR
Player Box Score
Flyers| Player | BS | HT | TK | +/- | TOI | PPTOI | SHTOI | ESTOI | SHFT | G | YTDG | A | S | SM | SOG | FW | FL | FO% | GV | PN | PIM |
|---|---|---|---|---|---|---|---|---|---|---|---|---|---|---|---|---|---|---|---|---|---|
 Bobby Brink#46 · RW | 0 | 8 | 1 | -1 | 13:12 | 2:01 | 0:00 | 11:11 | 17 | 0 | 0 | 0 | 2 | 1 | 0 | 0 | 0 | 0.0 | 1 | 0 | 0 |
 Noah Cates#49 · LW | 1 | 3 | 0 | -1 | 14:26 | 0:14 | 0:56 | 13:16 | 20 | 0 | 3 | 0 | 1 | 0 | 0 | 0 | 0 | 0.0 | 1 | 0 | 0 |
 Joel Farabee#86 · LW | 0 | 2 | 2 | 0 | 15:54 | 1:50 | 1:51 | 12:13 | 25 | 0 | 17 | 0 | 0 | 0 | 0 | 2 | 1 | 66.7 | 0 | 0 | 0 |
 Morgan Frost#48 · C | 1 | 3 | 1 | 0 | 15:19 | 2:09 | 0:04 | 13:06 | 20 | 0 | 3 | 0 | 5 | 2 | 0 | 3 | 10 | 23.1 | 0 | 0 | 0 |
 Kevin Hayes#13 · RW | 0 | 2 | 2 | -3 | 19:23 | 2:14 | 3:12 | 13:57 | 25 | 0 | 9 | 0 | 5 | 0 | 0 | 6 | 10 | 37.5 | 0 | 1 | 2 |
 Travis Konecny#11 · RW | 0 | 2 | 0 | -2 | 18:57 | 2:42 | 1:17 | 14:58 | 22 | 0 | 14 | 2 | 2 | 0 | 0 | 0 | 1 | 0.0 | 1 | 0 | 0 |
 Scott Laughton#21 · C | 0 | 4 | 0 | -1 | 15:29 | 1:31 | 3:26 | 10:32 | 23 | 0 | 11 | 0 | 0 | 0 | 0 | 9 | 4 | 69.2 | 1 | 0 | 0 |
 Oskar Lindblom#23 · LW | 0 | 4 | 0 | 0 | 10:56 | 0:00 | 0:45 | 10:11 | 17 | 0 | 11 | 0 | 2 | 0 | 0 | 0 | 1 | 0.0 | 0 | 0 | 0 |
 Zack MacEwen#17 · C | 0 | 4 | 0 | 0 | 10:24 | 0:00 | 0:00 | 10:24 | 17 | 0 | 3 | 0 | 0 | 1 | 0 | 0 | 1 | 0.0 | 1 | 2 | 7 |
 Nate Thompson#44 · C | 2 | 3 | 0 | 0 | 12:58 | 0:00 | 2:26 | 10:32 | 20 | 0 | 1 | 0 | 2 | 0 | 0 | 7 | 4 | 63.6 | 1 | 0 | 0 |
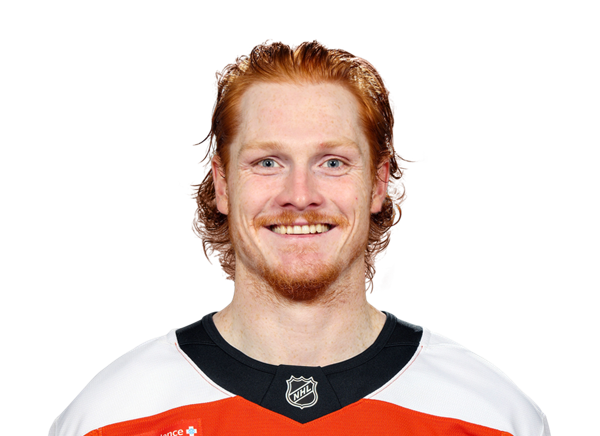 Owen Tippett#74 · RW | 0 | 4 | 0 | 0 | 13:50 | 1:58 | 0:10 | 11:42 | 19 | 0 | 9 | 0 | 1 | 1 | 0 | 0 | 0 | 0.0 | 2 | 0 | 0 |
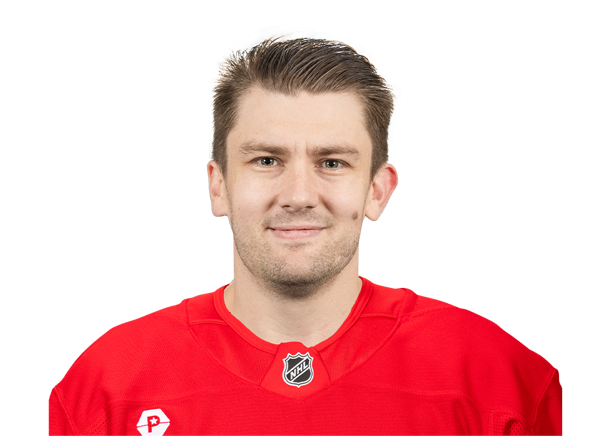 James van Riemsdyk#25 · LW | 0 | 2 | 0 | 0 | 14:54 | 1:59 | 0:00 | 12:55 | 18 | 1 | 21 | 0 | 4 | 1 | 0 | 1 | 0 | 100.0 | 0 | 0 | 0 |
Maple Leafs| Player | BS | HT | TK | +/- | TOI | PPTOI | SHTOI | ESTOI | SHFT | G | YTDG | A | S | SM | SOG | FW | FL | FO% | GV | PN | PIM |
|---|---|---|---|---|---|---|---|---|---|---|---|---|---|---|---|---|---|---|---|---|---|
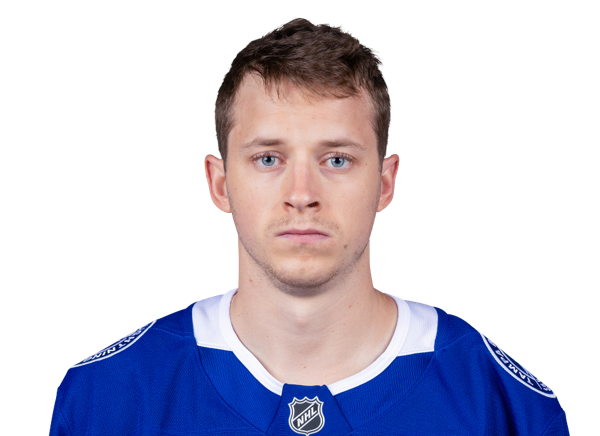 Nick Abruzzese#26 · C | 0 | 2 | 0 | -1 | 12:45 | 2:07 | 0:00 | 10:38 | 19 | 0 | 0 | 0 | 1 | 1 | 0 | 2 | 4 | 33.3 | 0 | 1 | 2 |
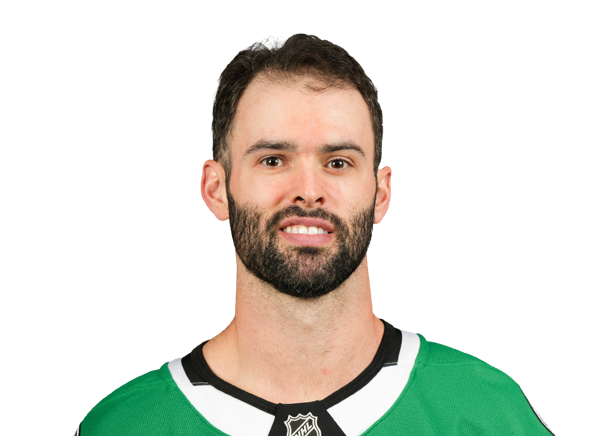 Colin Blackwell#11 · C | 0 | 3 | 0 | 0 | 12:40 | 0:13 | 1:13 | 11:14 | 18 | 0 | 10 | 0 | 3 | 0 | 0 | 6 | 2 | 75.0 | 0 | 0 | 0 |
 Michael Bunting#58 · LW | 1 | 3 | 0 | -2 | 14:45 | 4:18 | 0:00 | 10:27 | 18 | 0 | 23 | 0 | 2 | 1 | 0 | 2 | 0 | 100.0 | 1 | 0 | 0 |
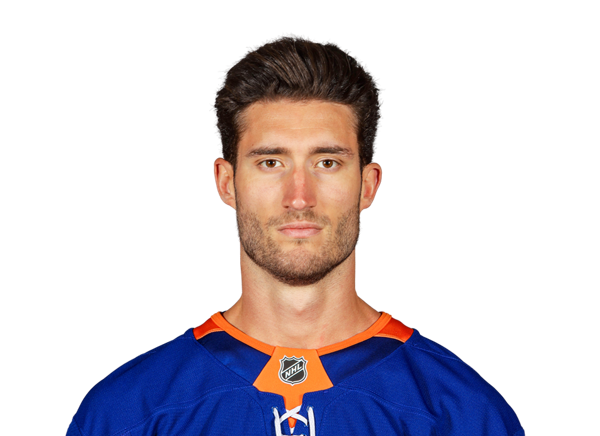 Pierre Engvall#47 · LW | 0 | 1 | 0 | 2 | 15:08 | 0:26 | 0:41 | 14:01 | 20 | 0 | 14 | 1 | 2 | 2 | 0 | 0 | 0 | 0.0 | 0 | 0 | 0 |
 David Kampf#64 · C | 2 | 1 | 1 | 2 | 16:36 | 0:29 | 1:04 | 15:03 | 22 | 1 | 11 | 0 | 1 | 1 | 0 | 6 | 7 | 46.2 | 0 | 1 | 2 |
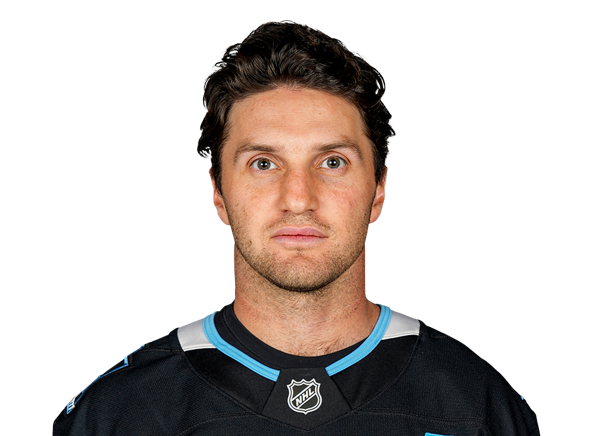 Alexander Kerfoot#15 · C | 0 | 2 | 0 | 1 | 14:13 | 0:09 | 1:47 | 12:17 | 20 | 0 | 13 | 1 | 0 | 1 | 0 | 4 | 5 | 44.4 | 3 | 0 | 0 |
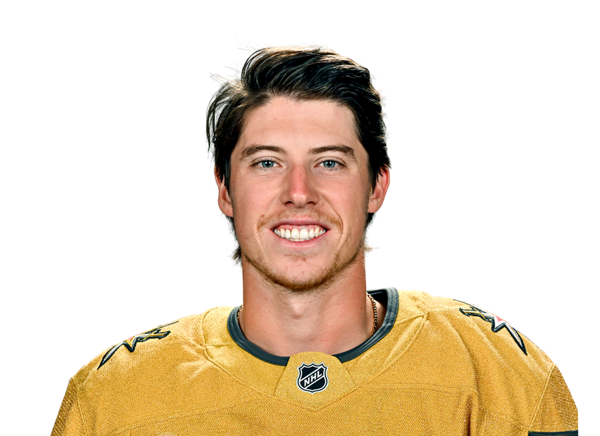 Mitch Marner#16 · RW | 0 | 0 | 1 | -1 | 17:17 | 4:28 | 1:45 | 11:04 | 21 | 0 | 34 | 1 | 1 | 0 | 0 | 0 | 1 | 0.0 | 1 | 0 | 0 |
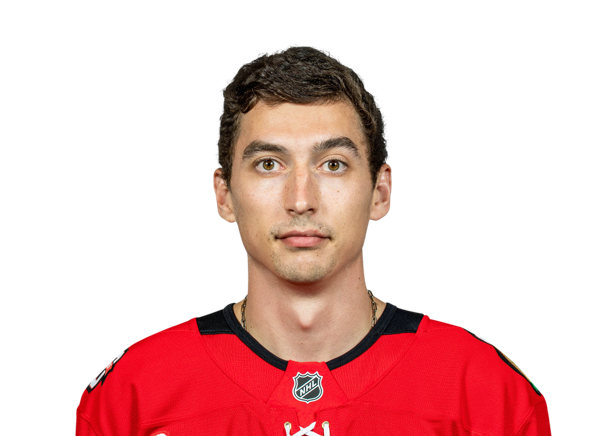 Ilya Mikheyev#65 · RW | 0 | 1 | 2 | 2 | 16:50 | 2:33 | 1:42 | 12:35 | 21 | 1 | 18 | 1 | 3 | 1 | 0 | 0 | 0 | 0.0 | 0 | 0 | 0 |
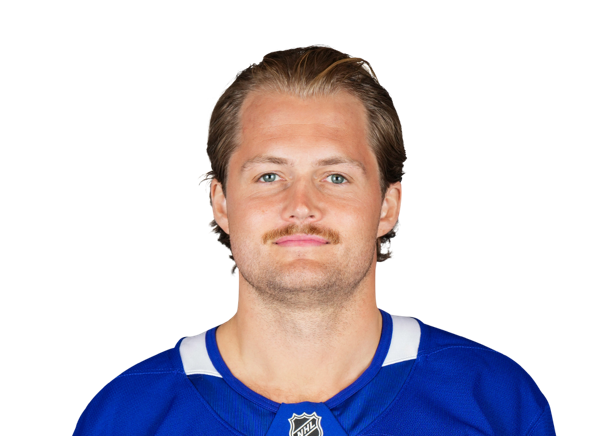 William Nylander#88 · RW | 0 | 0 | 0 | 2 | 15:57 | 4:24 | 0:14 | 11:19 | 20 | 1 | 32 | 1 | 3 | 0 | 0 | 3 | 1 | 75.0 | 0 | 0 | 0 |
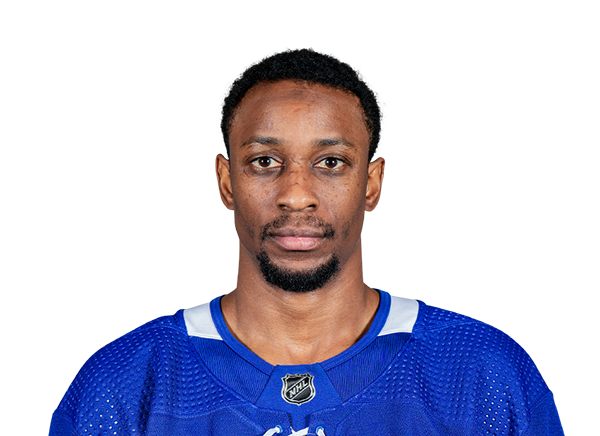 Wayne Simmonds#24 · RW | 0 | 6 | 0 | 1 | 11:40 | 0:00 | 0:00 | 11:40 | 15 | 0 | 5 | 1 | 1 | 2 | 0 | 0 | 0 | 0.0 | 2 | 0 | 0 |
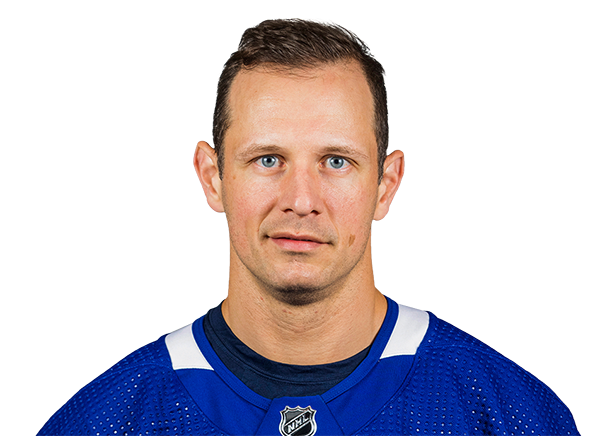 Jason Spezza#19 · C | 0 | 0 | 2 | 1 | 13:21 | 2:09 | 0:00 | 11:12 | 19 | 1 | 11 | 0 | 3 | 0 | 0 | 2 | 1 | 66.7 | 1 | 0 | 0 |
 John Tavares#91 · C | 0 | 2 | 0 | -1 | 17:06 | 4:16 | 0:00 | 12:50 | 20 | 0 | 26 | 1 | 2 | 1 | 0 | 7 | 7 | 50.0 | 1 | 0 | 0 |
Flyers| Player | BS | HT | TK | +/- | TOI | PPTOI | SHTOI | ESTOI | SHFT | G | YTDG | A | S | SM | SOG | FW | FL | FO% | GV | PN | PIM |
|---|---|---|---|---|---|---|---|---|---|---|---|---|---|---|---|---|---|---|---|---|---|
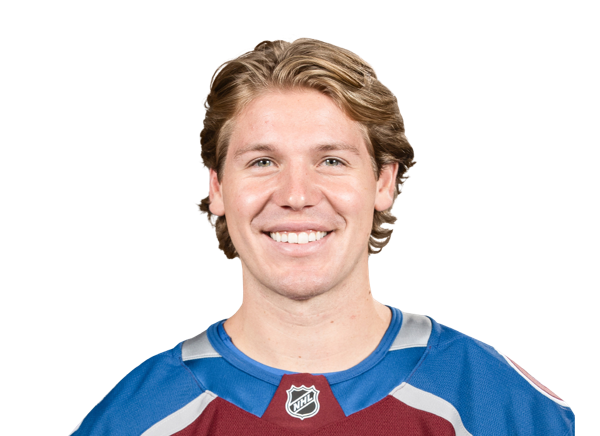 Ronnie Attard#47 · D | 0 | 2 | 0 | 2 | 17:26 | 0:00 | 3:28 | 13:58 | 22 | 1 | 2 | 0 | 1 | 0 | 0 | 0 | 0 | 0.0 | 0 | 0 | 0 |
 Kevin Connauton#8 · D | 0 | 3 | 0 | -1 | 13:29 | 0:00 | 1:45 | 11:44 | 16 | 0 | 1 | 0 | 1 | 0 | 0 | 0 | 0 | 0.0 | 0 | 0 | 0 |
 Ivan Provorov#9 · D | 3 | 5 | 0 | -2 | 26:59 | 2:13 | 3:28 | 21:18 | 33 | 0 | 8 | 0 | 6 | 0 | 0 | 0 | 0 | 0.0 | 1 | 1 | 2 |
 Travis Sanheim#6 · D | 2 | 4 | 0 | 0 | 26:39 | 2:14 | 3:15 | 21:10 | 30 | 0 | 7 | 0 | 6 | 2 | 0 | 0 | 0 | 0.0 | 3 | 1 | 2 |
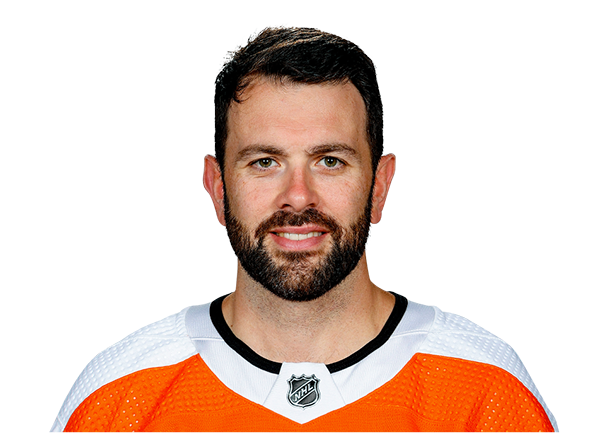 Keith Yandle#3 · D | 2 | 1 | 0 | -1 | 13:04 | 0:00 | 0:52 | 12:12 | 20 | 0 | 1 | 1 | 1 | 0 | 0 | 0 | 0 | 0.0 | 0 | 1 | 2 |
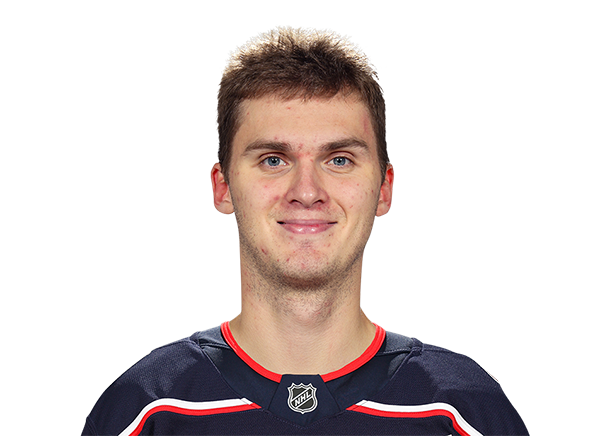 Egor Zamula#54 · D | 2 | 2 | 1 | -1 | 18:23 | 0:00 | 1:17 | 17:06 | 22 | 0 | 0 | 0 | 0 | 0 | 0 | 0 | 0 | 0.0 | 1 | 0 | 0 |
Maple Leafs| Player | BS | HT | TK | +/- | TOI | PPTOI | SHTOI | ESTOI | SHFT | G | YTDG | A | S | SM | SOG | FW | FL | FO% | GV | PN | PIM |
|---|---|---|---|---|---|---|---|---|---|---|---|---|---|---|---|---|---|---|---|---|---|
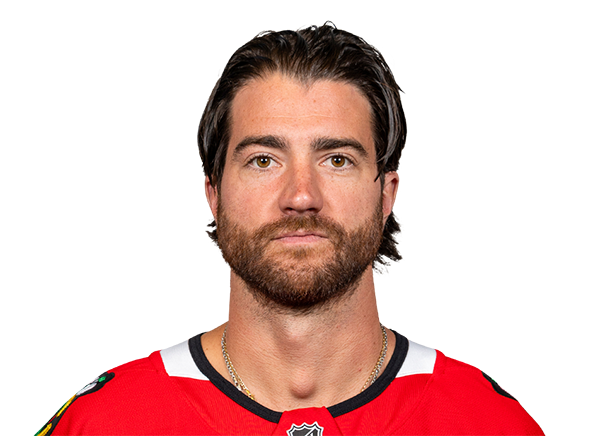 TJ Brodie#78 · D | 0 | 0 | 0 | 2 | 19:38 | 0:29 | 1:16 | 17:53 | 27 | 0 | 4 | 1 | 0 | 0 | 0 | 0 | 0 | 0.0 | 0 | 1 | 2 |
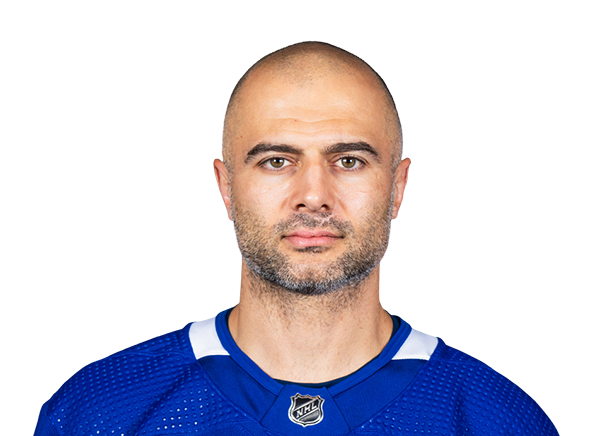 Mark Giordano#55 · D | 1 | 2 | 0 | 3 | 18:35 | 2:22 | 1:48 | 14:25 | 24 | 0 | 8 | 1 | 2 | 0 | 0 | 0 | 0 | 0.0 | 0 | 0 | 0 |
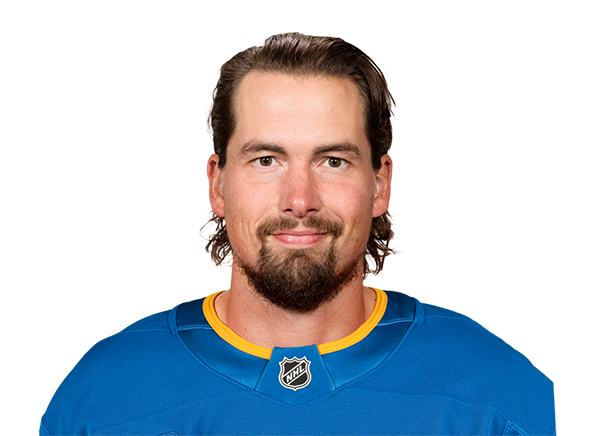 Justin Holl#3 · D | 0 | 6 | 0 | 1 | 20:39 | 0:10 | 2:25 | 18:04 | 27 | 0 | 2 | 0 | 1 | 0 | 0 | 0 | 0 | 0.0 | 3 | 0 | 0 |
 Timothy Liljegren#37 · D | 2 | 2 | 1 | 0 | 19:59 | 2:08 | 1:48 | 16:03 | 25 | 1 | 5 | 0 | 2 | 0 | 0 | 0 | 0 | 0.0 | 1 | 0 | 0 |
 Ilya Lyubushkin#46 · D | 1 | 1 | 0 | -1 | 15:11 | 0:00 | 0:00 | 15:11 | 21 | 0 | 1 | 1 | 0 | 0 | 0 | 0 | 0 | 0.0 | 3 | 1 | 5 |
 Morgan Rielly#44 · D | 1 | 1 | 1 | -1 | 21:40 | 4:34 | 1:09 | 15:57 | 27 | 0 | 10 | 0 | 2 | 2 | 0 | 0 | 0 | 0.0 | 3 | 0 | 0 |
Flyers| Player | GA | SA | SOS | SOSA | SV | SV% | ESSV | PPSV | SHSV | TOI | YTDG | PIM |
|---|---|---|---|---|---|---|---|---|---|---|---|---|
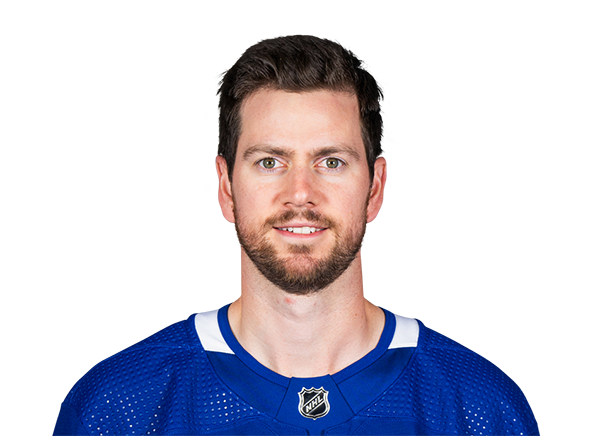 Martin Jones#35 · G | 4 | 28 | 0 | 0 | 24 | .857 | 21 | 1 | 2 | 59:28 | 0 | 0 |
Maple Leafs| Player | GA | SA | SOS | SOSA | SV | SV% | ESSV | PPSV | SHSV | TOI | YTDG | PIM |
|---|---|---|---|---|---|---|---|---|---|---|---|---|
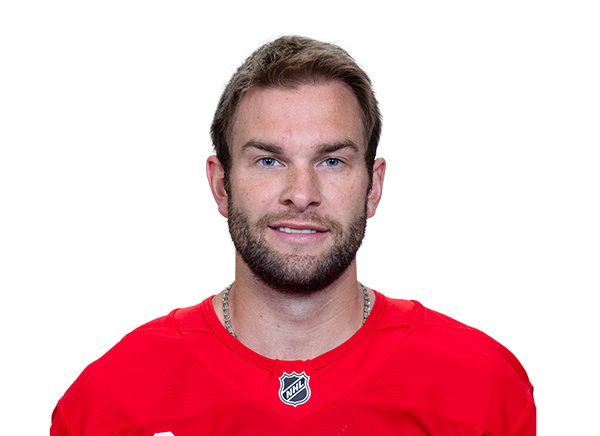 Jack Campbell#36 · G | 2 | 39 | 0 | 0 | 37 | .949 | 26 | 3 | 8 | 60:00 | 0 | 0 |
Injury Report

Head-to-Head
PHILast 2 Games
TOR
3
NHL Regular Season
FINAL
Apr 2, 2022
▸6
0
NHL Regular Season
FINAL
Nov 10, 2021
▸3
Last 5 Games








Game Information
Stage
Regular Season
Season
2022
Puck Drop
Tue, Apr 19, 7:00 PM
Venue
Scotiabank Arena
Location
Toronto, Canada
Broadcast
ESPN+
Attendance
18,291
Officials
Steve Kozari · Referee, Ryan Daisy · Linesman, Beau Halkidis · Referee, Kyle Flemington · Linesman
Division Standings
Eastern Conference — Atlantic Division

Eastern Conference — Metropolitan Division
| Team | GP | W | L | OT | Pct | PTS | DIFF | Strk |
|---|---|---|---|---|---|---|---|---|
 Hurricanes | 82 | 53 | 22 | 7 | — | 113 | +56 | W1 |
 Penguins | 82 | 41 | 25 | 16 | — | 98 | +25 | L3 |
| Flyers | 82 | 43 | 27 | 12 | — | 98 | +7 | W3 |
 Capitals | 82 | 43 | 30 | 9 | — | 95 | +19 | W4 |
 Blue Jackets | 82 | 40 | 30 | 12 | — | 92 | 0 | L2 |
 Islanders | 82 | 43 | 34 | 5 | — | 91 | -8 | L3 |
 Devils | 82 | 42 | 37 | 3 | — | 87 | -24 | L1 |
 Rangers | 82 | 34 | 39 | 9 | — | 77 | -12 | W1 |
Flyers
14th in Eastern Conference
VS
Maple Leafs
8th in Eastern Conference
Goaltenders
#80

Dan Vladar
#53
Joseph Woll
Defensemen
#44
Simon Benoit
#59

Oliver Bonk
#9

Jamie Drysdale
#3

Helge Grans
#5

David Jiricek
#55

Rasmus Ristolainen
#6
Travis Sanheim
#24

Nick Seeler
#8

Cam York
Left Wings
#20

Alex Bump
#58
Michael Bunting
#27
Noah Cates
Centers
#52

Noel Acciari
#86
Denver Barkey
#14

Sean Couturier
#22

Christian Dvorak
#17

Jett Luchanko
#46

Trevor Zegras
Right Wings
#71
Tyson Foerster
#54

Cole Knuble
#11
Travis Konecny
#94
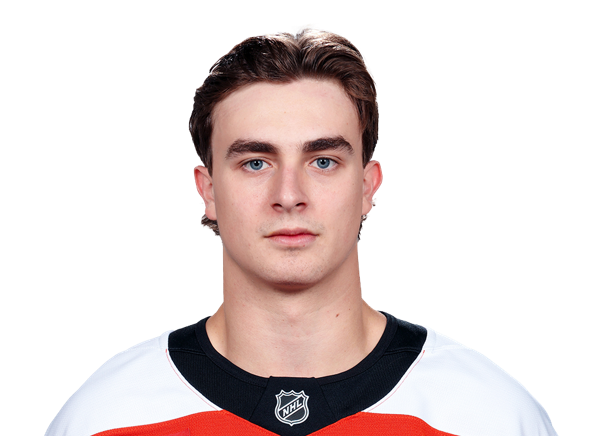
Porter Martone
#39
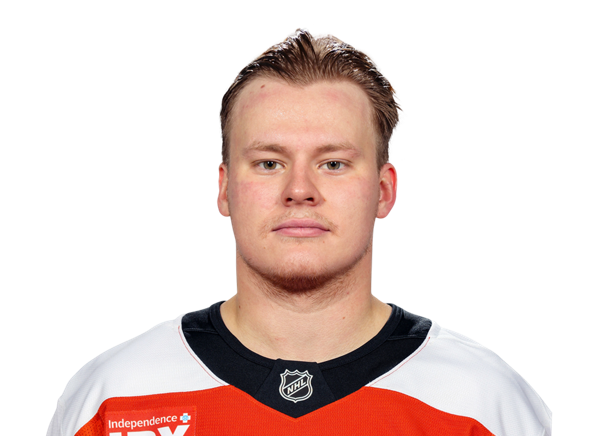
Matvei Michkov
#74
Owen Tippett
Goaltenders
#72

Sergei Bobrovsky

Elvis Merzlikins
#41
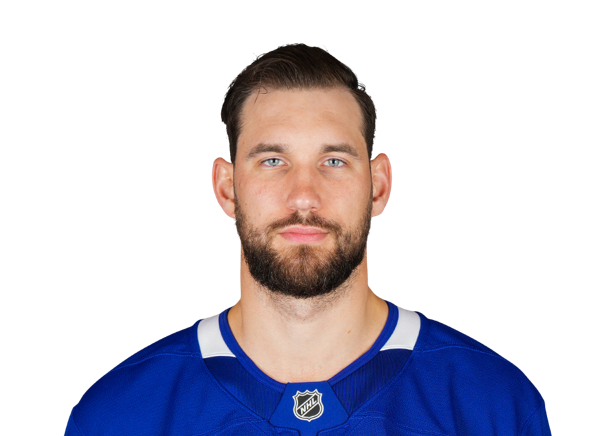
Anthony Stolarz
Defensemen
#3
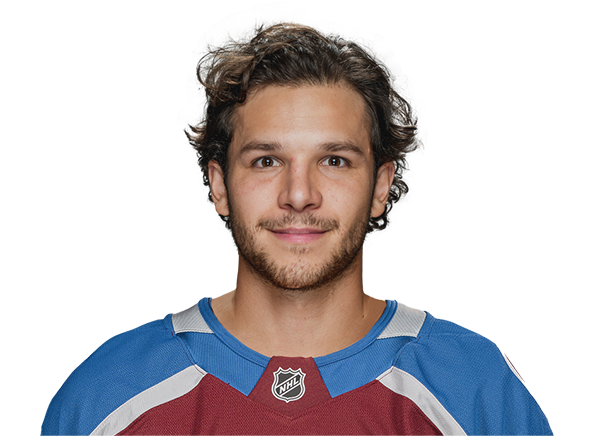
Nick Blankenburg
#95

Oliver Ekman-Larsson
#66

Matt Hellickson
#22

Jake McCabe
#36

Dakota Mermis
#43

Darren Raddysh
#44
Morgan Rielly
#83
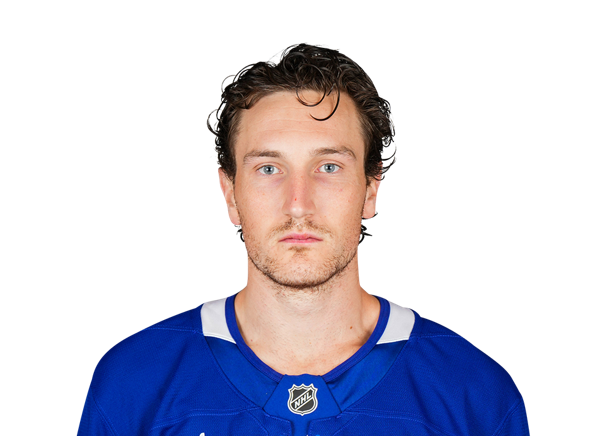
Marshall Rifai
#28

Troy Stecher
#8
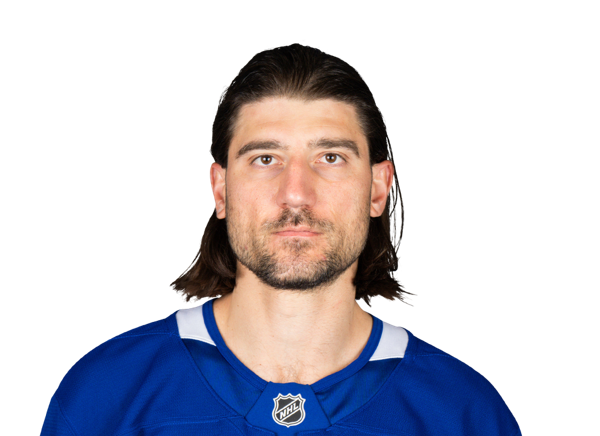
Chris Tanev
#76
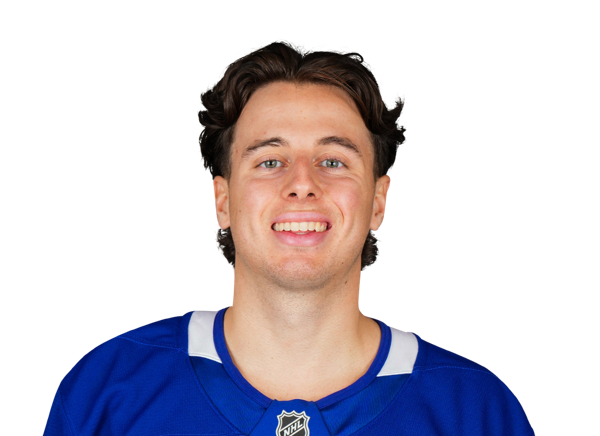
William Villeneuve
#52
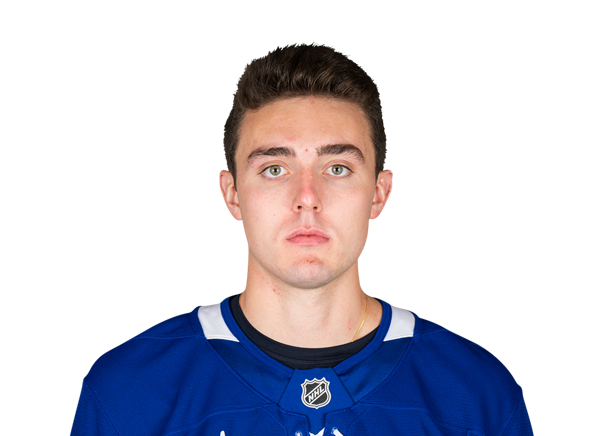
Cade Webber
Left Wings
#92
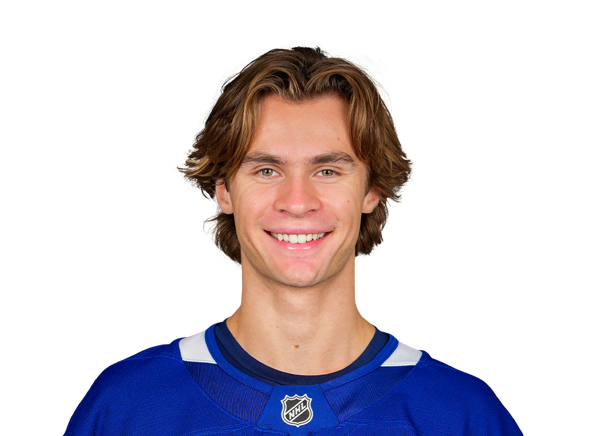
Gavin McKenna
#20

Nick Paul
#18

Miles Wood
Centers
#73

Teddy Blueger
#37
Luke Haymes
#81

Dakota Joshua
#71
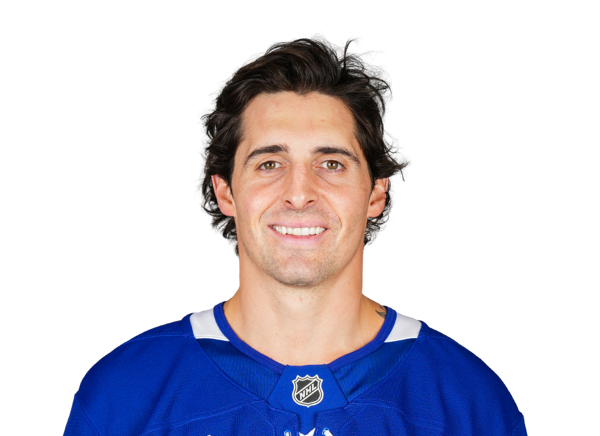
Vinni Lettieri
#19
Zack MacEwen
#34

Auston Matthews
#54
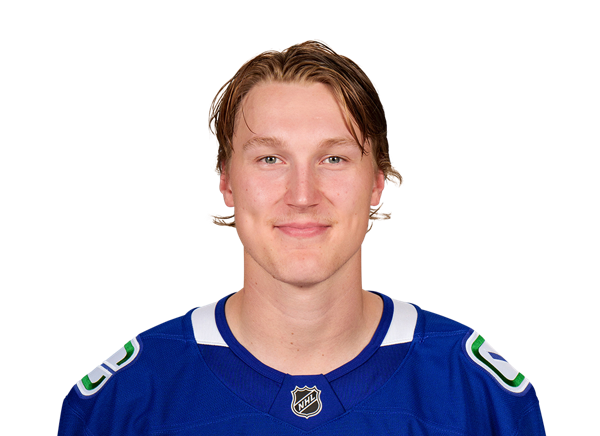
Aatu Raty
#96

Jack Roslovic
#15

Colton Sissons
#91
John Tavares
Right Wings
#53
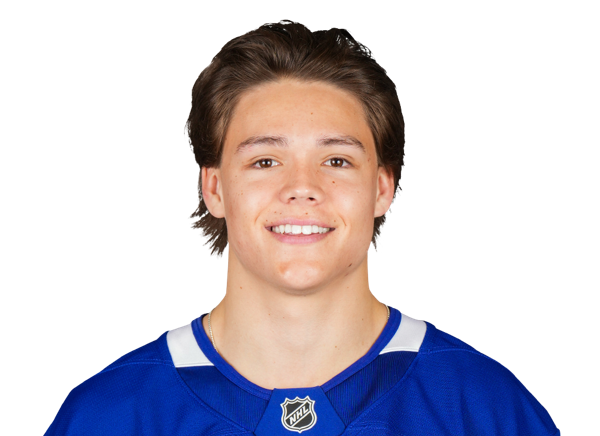
Easton Cowan
#24
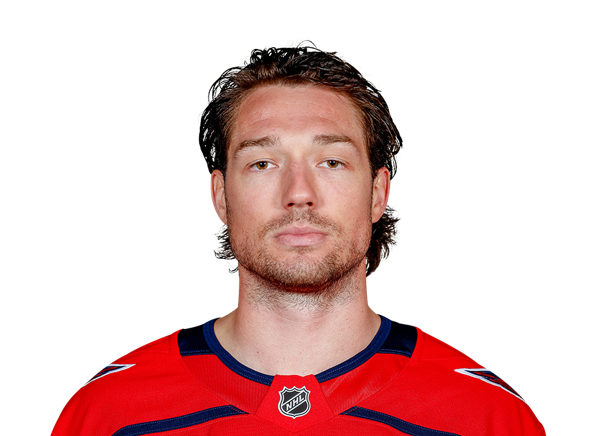
Brandon Duhaime
#86
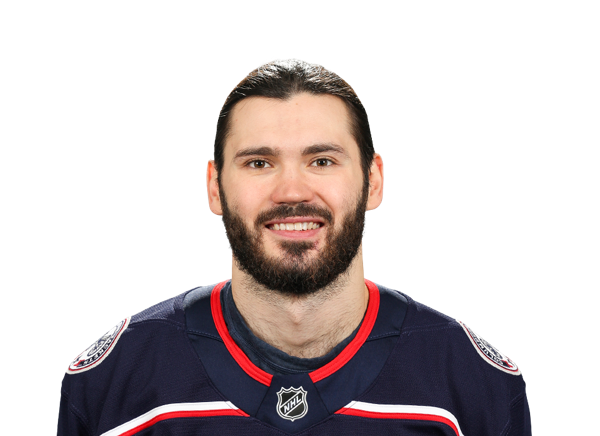
Kirill Marchenko
#88
William Nylander
Flyers
6th in Metropolitan Division
VS
Maple Leafs
6th in Atlantic Division
General
17
Games Played
17
6067:33
Time On Ice
6049:10
356:54
Time On Ice Per Game
355:50
0
Plus/Minus Rating
0
0:00
Production
0:00
6451
Shifts
6382
9
Losses
7
4
Wins
8
Offensive
37
Goals
62
66
Assists
109
493
Faceoffs Won
512
481
Faceoffs Lost
454
0
Game-Winning Goals
0
103
Points
171
9
Power Play Goals
15
18
Power Play Assists
27
1
Short Handed Goals
1
1
Short Handed Assists
1
398
Shots
479
5
Shootout Attempts
5
1
Shootout Goals
1
20.0
Shootout Shot Percentage
20.0
9.3
Shooting Percentage
12.9
50.6
Faceoff Win Percent
53.0
Defensive
3.35
Goals Against Average
3.24
441
Saves
450
.891
Save Percentage
.896
57
Goals Against
55
498
Shots Against
505
4
Overtime Losses
2
3
Shootout Saves
3
5
Shootout Shots Against
5
.600
Shootout Save Percentage
.600
Penalties
172
Penalty Minutes
173