

76ers vs Heat Live Score (30 Jan, 2027)
Game Information
League
NBA
Season
1
Date
January 30, 2027
Tipoff
12:30 PM EST
Status
Scheduled
Team Stats
 PHI
Game Comparison
MIA

-Points-
-Rebounds-
-Assists-
44Field Goal %47
-3-Point %-
-Free Throw %-
Game Leaders
PHIMIA
 —#
Points
—
—#
—#Rebounds
—
—#
—#Assists
—
—#
Injury Report

H2H / Season Series
Last 5 Games





NBA Standings
Eastern Conference — Atlantic
| Team | W | L | PCT | GB | STRK |
|---|---|---|---|---|---|
| Philadelphia | 5 | 1 | .833 | - | W2 |
 Boston | 4 | 1 | .800 | 0.5 | W4 |
 Toronto | 3 | 2 | .600 | 1.5 | L1 |
 New York | 2 | 4 | .333 | 3 | L1 |
 Brooklyn | 0 | 5 | .000 | 4.5 | L5 |
Eastern Conference — Southeast
| Team | W | L | PCT | GB | STRK |
|---|---|---|---|---|---|
 Atlanta | 3 | 3 | .500 | - | W1 |
 Washington | 3 | 3 | .500 | - | W1 |
 Charlotte | 3 | 3 | .500 | - | L2 |
 Orlando | 2 | 3 | .400 | 0.5 | W1 |
| Miami | 2 | 4 | .333 | 1 | W2 |
Rosters
76ers
1st in Atlantic Division
VS
Heat
9th in Eastern Conference Division
Guard

Tyrese Maxey
#7

Jaylen Brown
#77
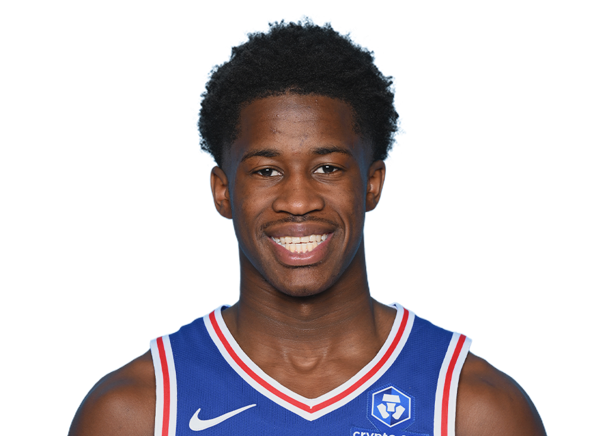
VJ Edgecombe
#5
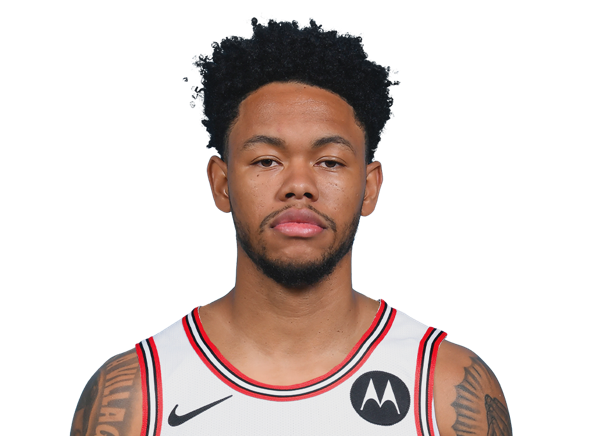
Anfernee Simons
#1

Kentavious Caldwell-Pope
#00

Labaron Philon Jr.
#12

Rayan Rupert
#8

Caleb Love
Center
#21
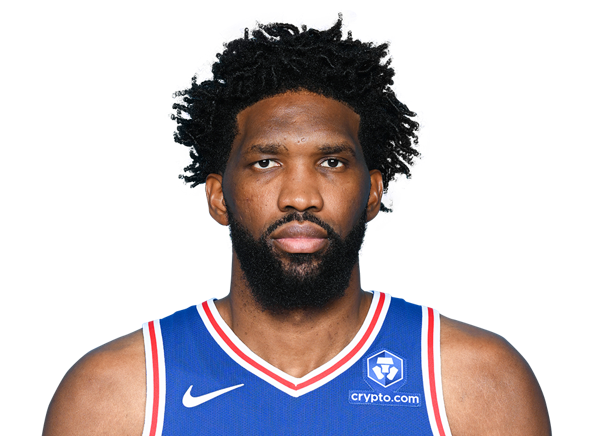
Joel Embiid
#30

Adem Bona
#55

Ariel Hukporti
Forward
#23
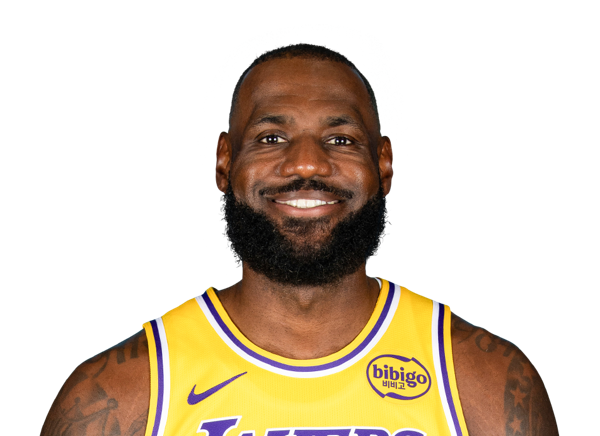
LeBron James
#45

Dean Wade
#33
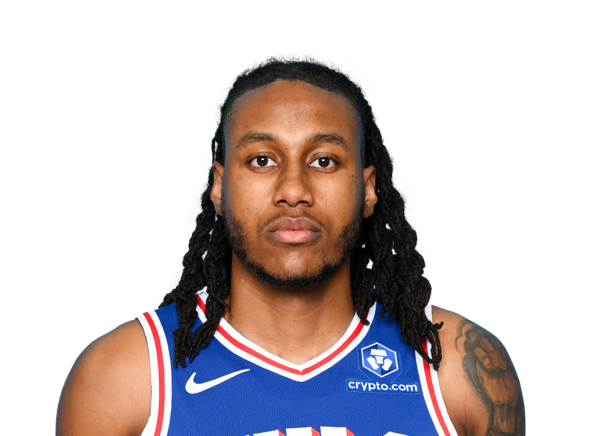
Jabari Walker
#11

Justin Edwards
#25

Dominick Barlow
Forward
#7
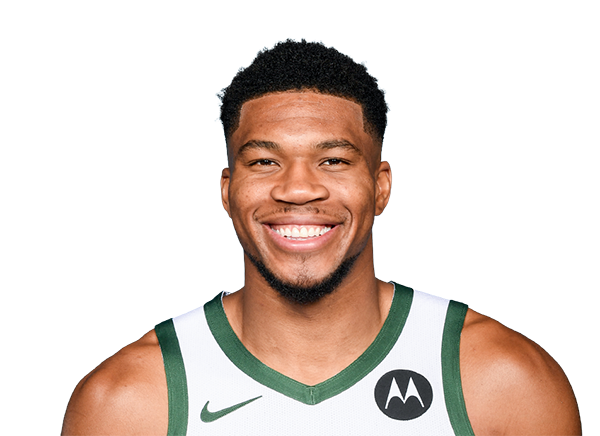
Giannis Antetokounmpo
#22

Andrew Wiggins
#95

Bobby Portis
#5

Nikola Jovic
#15

Myron Gardner

Simone Fontecchio
Center
#13

Bam Adebayo
#8

Nick Richards
Guard
#2

Davion Mitchell
#11
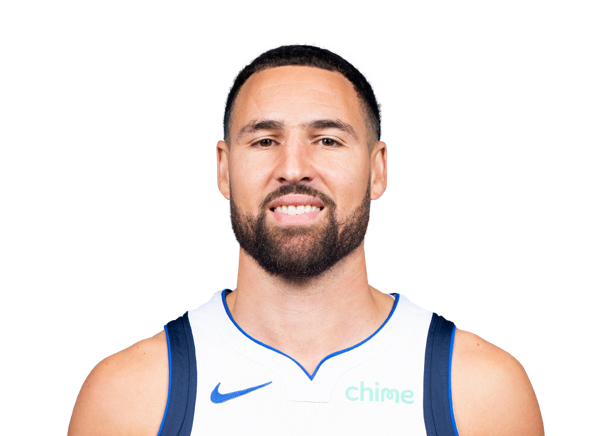
Klay Thompson
#9

Pelle Larsson
#10

Tim Hardaway Jr.
#4

Ryan Conwell
#12

Dru Smith
Team Statistics
76ers
1st in Atlantic Division
VS
Heat
9th in Eastern Conference Division
General
42.3
Rebounds Per Game
43.3
2.1
Assist To Turnover Ratio
2.0
21.9
Fouls Per Game
20.8
9
Games Played
8
0
Games Started
0
0
Minutes
0
0.0
Minutes Per Game
0.0
381
Rebounds
346
381
Rebounds
346
Offensive
76.7
Free Throw Percentage
73.9
34.4
3-Point Field Goal Percentage
33.5
39.9
Average Field Goals Made
42.8
88.2
Average Field Goals Attempted
90.6
11.4
Average 3-Point Field Goals Made
13.0
33.2
Average 3-Point Field Goals Attempted
38.8
19.8
Average Free Throws Made
19.5
25.8
Average Free Throws Attempted
26.4
111.0
Points Per Game
118.0
9.4
Offensive Rebounds Per Game
10.8
26.1
Assists Per Game
29.5
12.3
Turnovers Per Game
14.8
51.7
2-Point Field Goal Percentage
57.3
1.258
Scoring Efficiency
1.302
0.52
Shooting Efficiency
0.54
45.2
Field Goal Percentage
47.2
256.0
2-Point Field Goals Made
238.0
495.0
2-Point Field Goals Attempted
415.0
999
Points
944
85
Offensive Rebounds
86
235
Assists
236
111
Turnovers
118
359
Field Goals Made
342
794
Field Goals Attempted
725
178
Free Throws Made
156
232
Free Throws Attempted
211
103
3-Point Field Goals Made
104
299
3-Point Field Goals Attempted
310
34.4
3-Point Field Goal Percentage
33.5
28.4
2-Point Field Goals Made per Game
29.8
55.0
2-Point Field Goals Attempted per Game
51.9
Defensive
32.9
Defensive Rebounds Per Game
32.5
4.7
Blocks Per Game
5.1
8.9
Steals Per Game
8.4
296
Defensive Rebounds
260
80
Steals
67
42
Blocks
41