

Kings vs Pacers Live Score (13 Feb, 2027)
Game Information
League
NBA
Season
1
Date
February 13, 2027
Tipoff
2:00 PM EST
Status
Scheduled
Team Stats
 SAC
Game Comparison
IND
-Points-
-Rebounds-
-Assists-
46Field Goal %47
-3-Point %-
-Free Throw %-
Game Leaders
SACIND
 —#
Points
—
—#
—#
Rebounds
—
—#
—#
Assists
—
—#
Injury Report
Indiana Pacers
H2H / Season Series
Last 5 Games









NBA Standings
Western Conference — Pacific
| Team | W | L | PCT | GB | STRK |
|---|---|---|---|---|---|
 LA Lakers | 11 | 2 | .846 | - | W7 |
 Golden State | 8 | 5 | .615 | 3 | L2 |
 Phoenix | 5 | 6 | .455 | 5 | W2 |
 LA Clippers | 3 | 8 | .273 | 7 | W1 |
| Sacramento | 1 | 11 | .083 | 9.5 | L5 |




Rosters
Kings
5th in Pacific Division
VS
Pacers
3rd in Central Division
Guard
#5
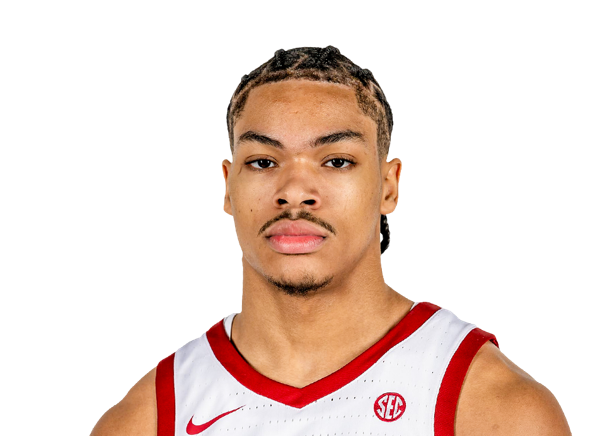
Darius Acuff Jr.
#8

Zach LaVine
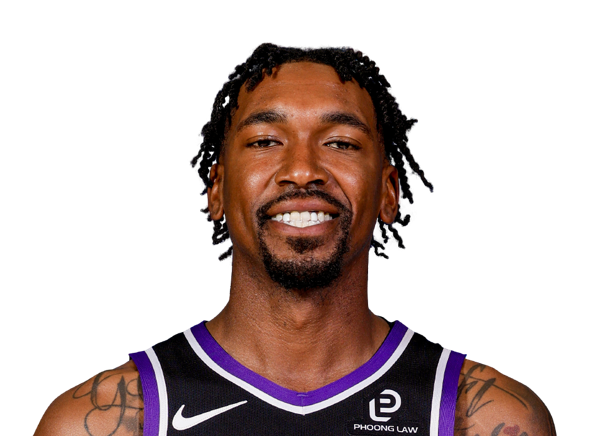
Malik Monk
#34

Emanuel Sharp
#29
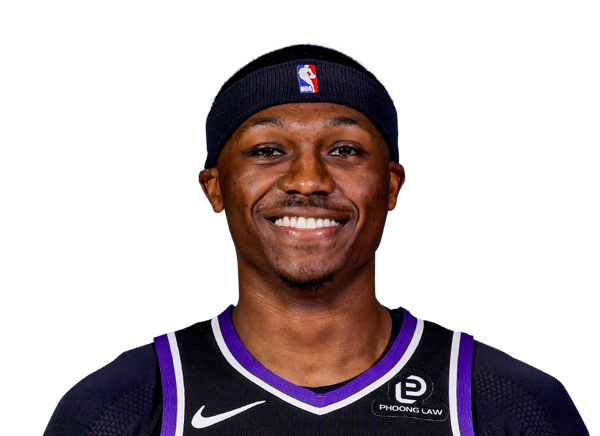
Daeqwon Plowden
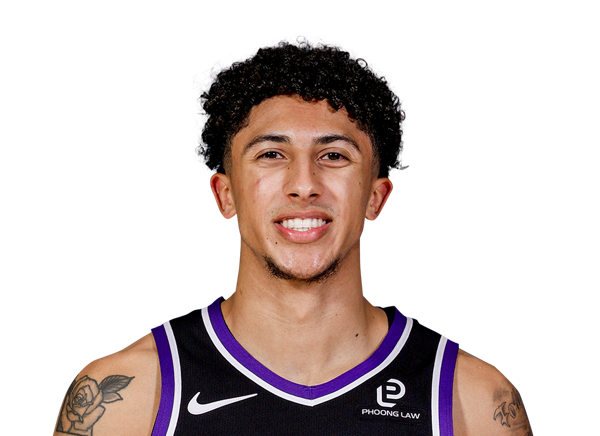
Nique Clifford
#25
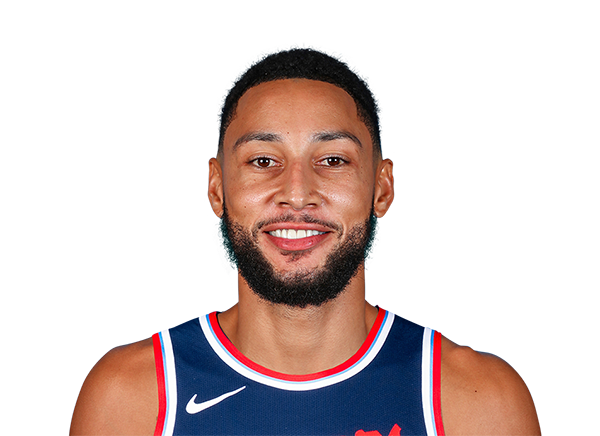
Ben Simmons
Forward
#15

De'Andre Hunter
#11

Domantas Sabonis
#9
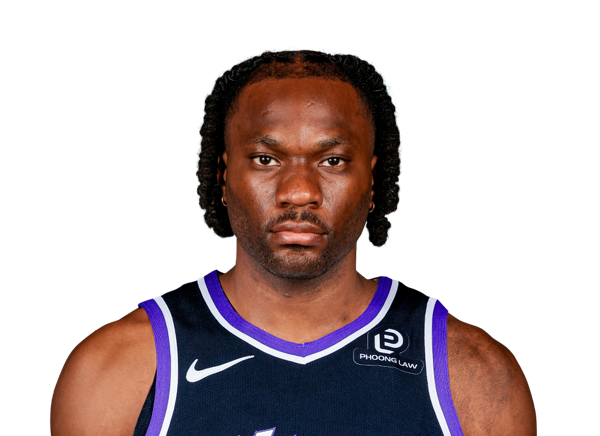
Precious Achiuwa
#19
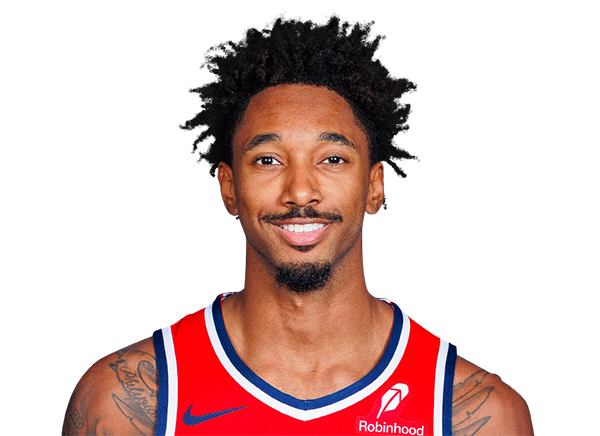
Leaky Black
#13
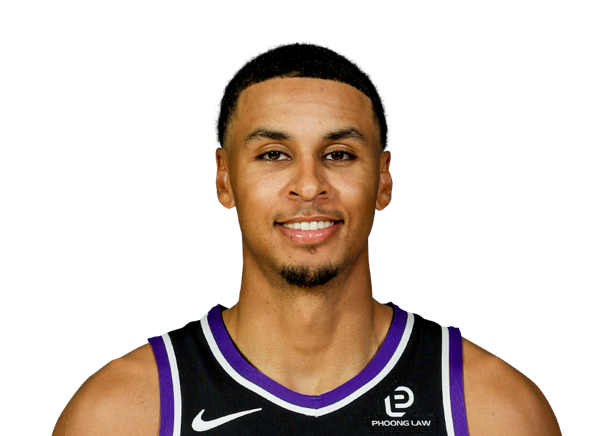
Keegan Murray
#22

Jonathan Mogbo
#33
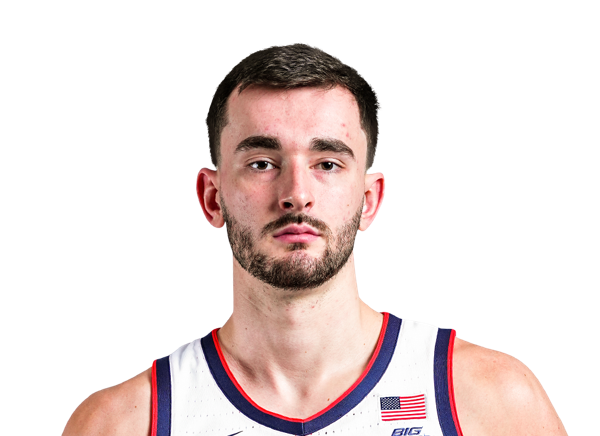
Alex Karaban
Center
#32
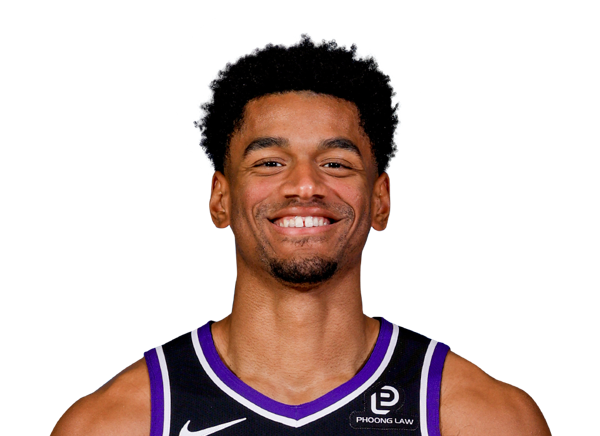
Dylan Cardwell
#24

Mason Plumlee
#42

Maxime Raynaud
Forward
#43

Pascal Siakam
#1
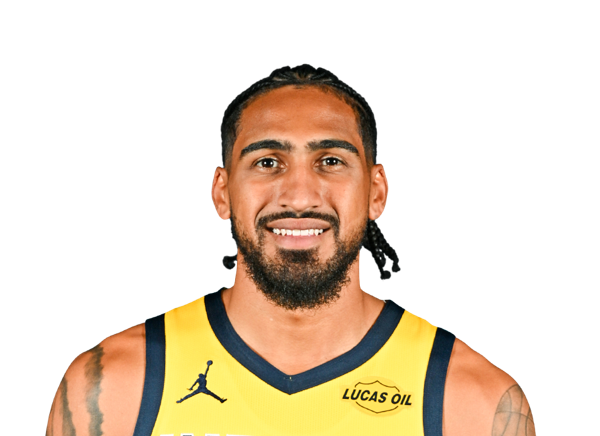
Obi Toppin
#5
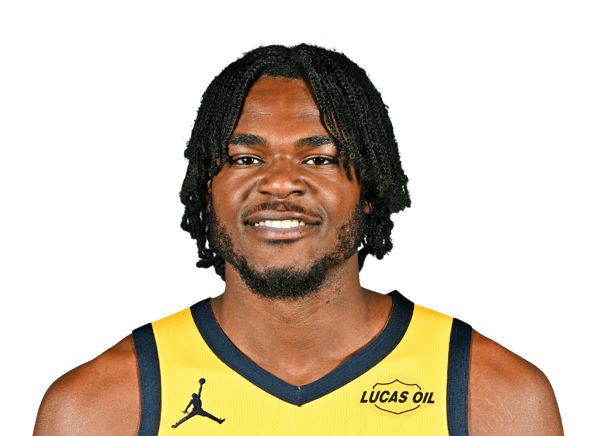
Jarace Walker
#22
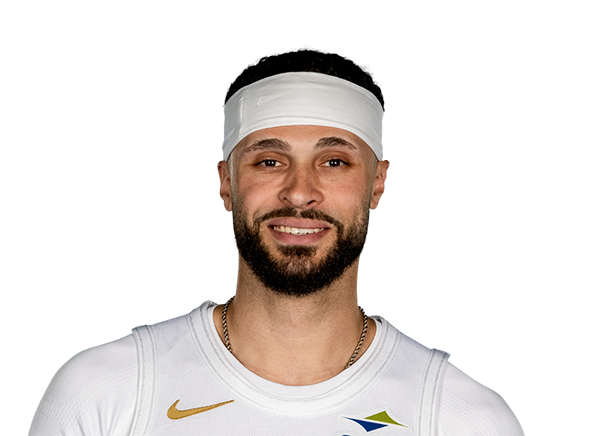
Larry Nance Jr.
#18

Jalen Slawson
Guard
#2

Andrew Nembhard
#23

Aaron Nesmith
#10

Kelly Oubre Jr.
#29
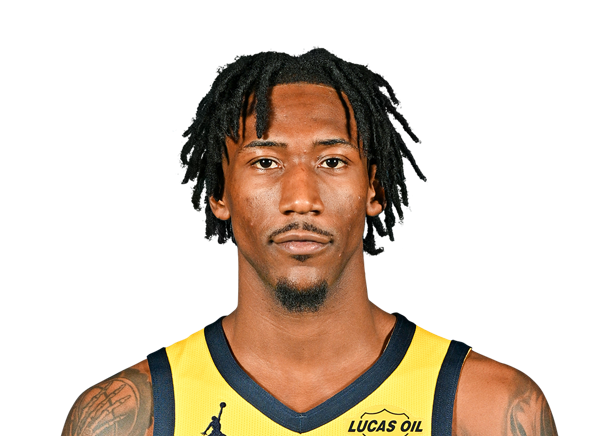
Quenton Jackson
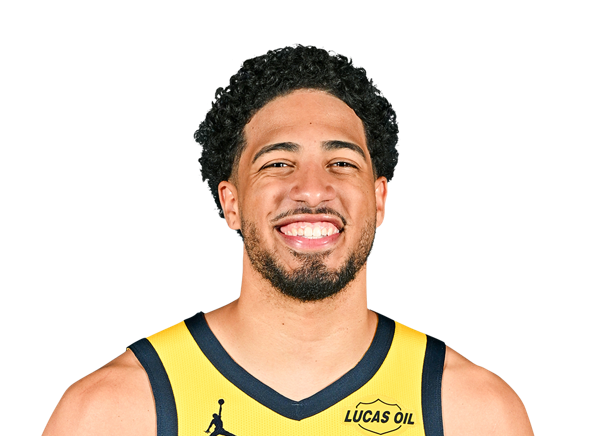
Tyrese Haliburton
#9

T.J. McConnell
#24

Kobe Brown
#3

Braden Smith
#26
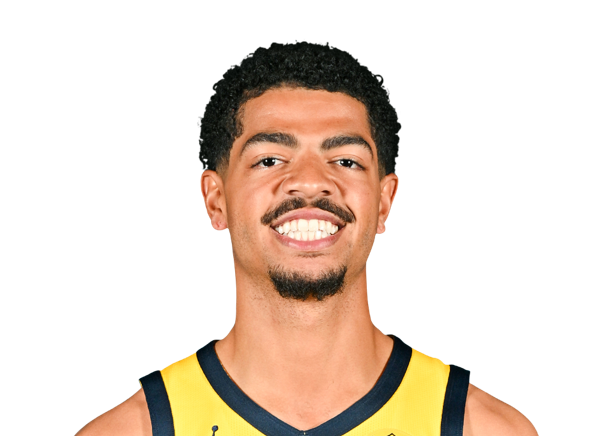
Ben Sheppard
#12

Johnny Furphy
Center
#40
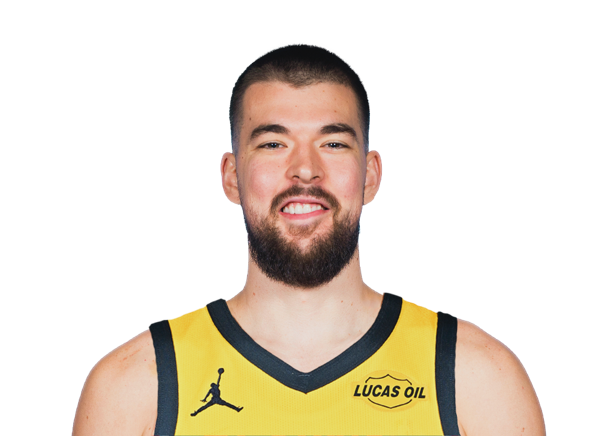
Ivica Zubac
#32

Jay Huff
Team Statistics
Kings
5th in Pacific Division
VS
Pacers
3rd in Central Division
General
39.7
Rebounds Per Game
41.6
1.6
Assist To Turnover Ratio
2.0
22.9
Fouls Per Game
20.4
13
Games Played
14
0
Games Started
0
0
Minutes
0
0.0
Minutes Per Game
0.0
516
Rebounds
583
516
Rebounds
583
Offensive
76.7
Free Throw Percentage
76.5
34.3
3-Point Field Goal Percentage
32.8
39.1
Average Field Goals Made
40.9
85.9
Average Field Goals Attempted
87.1
12.4
Average 3-Point Field Goals Made
11.9
36.1
Average 3-Point Field Goals Attempted
36.1
17.2
Average Free Throws Made
18.4
22.5
Average Free Throws Attempted
24.0
107.8
Points Per Game
112.1
9.8
Offensive Rebounds Per Game
9.6
25.2
Assists Per Game
27.8
16.2
Turnovers Per Game
13.8
53.5
2-Point Field Goal Percentage
57.1
1.254
Scoring Efficiency
1.287
0.53
Shooting Efficiency
0.54
45.5
Field Goal Percentage
47.0
347.0
2-Point Field Goals Made
407.0
648.0
2-Point Field Goals Attempted
713.0
1401
Points
1569
127
Offensive Rebounds
135
327
Assists
389
210
Turnovers
193
508
Field Goals Made
573
1117
Field Goals Attempted
1219
224
Free Throws Made
257
292
Free Throws Attempted
336
161
3-Point Field Goals Made
166
469
3-Point Field Goals Attempted
506
34.3
3-Point Field Goal Percentage
32.8
26.7
2-Point Field Goals Made per Game
29.1
49.8
2-Point Field Goals Attempted per Game
50.9
Defensive
29.9
Defensive Rebounds Per Game
32.0
3.5
Blocks Per Game
4.2
7.8
Steals Per Game
7.2
389
Defensive Rebounds
448
102
Steals
101
45
Blocks
59