

Magic vs 76ers Live Score (13 Dec, 2026)
Game Information
League
NBA
Season
1
Date
December 12, 2026
Tipoff
7:30 PM EST
Status
Scheduled
Team Stats
 ORL
Game Comparison
PHI
-Points-
-Rebounds-
-Assists-
46Field Goal %46
-3-Point %-
-Free Throw %-
Game Leaders
ORLPHI
 —#
Points
—
—#
—#
Rebounds
—
—#
—#
Assists
—
—#
Injury Report
H2H / Season Series
Last 5 Games




NBA Standings
Eastern Conference — Southeast
| Team | W | L | PCT | GB | STRK |
|---|---|---|---|---|---|
 Miami | 9 | 6 | .600 | - | W6 |
 Atlanta | 9 | 6 | .600 | - | W2 |
| Orlando | 6 | 8 | .429 | 2.5 | L1 |
 Washington | 5 | 11 | .313 | 4.5 | W1 |
 Charlotte | 4 | 10 | .286 | 4.5 | L3 |
Eastern Conference — Atlantic
| Team | W | L | PCT | GB | STRK |
|---|---|---|---|---|---|
| Philadelphia | 13 | 3 | .813 | - | W4 |
 Boston | 11 | 4 | .733 | 1.5 | L2 |
 New York | 9 | 6 | .600 | 3.5 | W3 |
 Toronto | 5 | 10 | .333 | 7.5 | L6 |
 Brooklyn | 3 | 11 | .214 | 9 | L3 |
Rosters
Magic
8th in Eastern Conference Division
VS
76ers
1st in Atlantic Division
Forward
#22
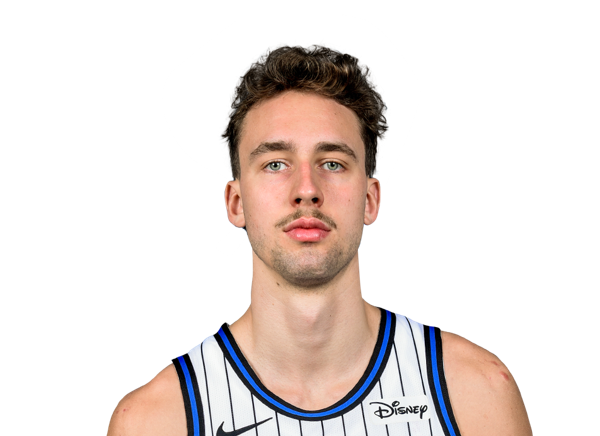
Franz Wagner
#23
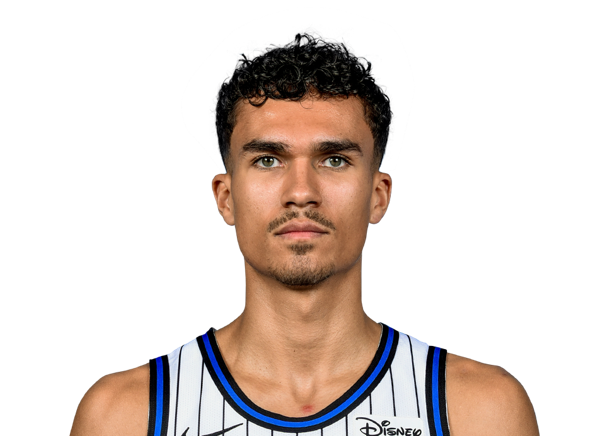
Tristan da Silva
#8

Jamal Cain
#5

Paolo Banchero
#1

Jonathan Isaac
#25
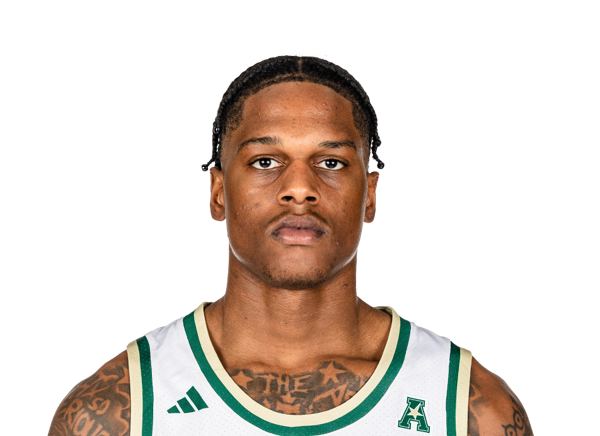
Izaiyah Nelson
#93
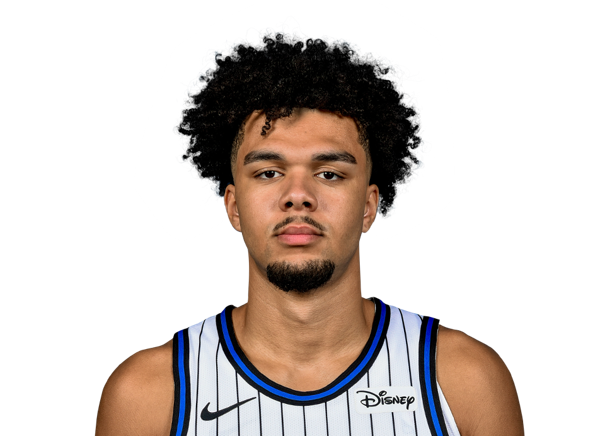
Noah Penda
Guard
#3

Desmond Bane
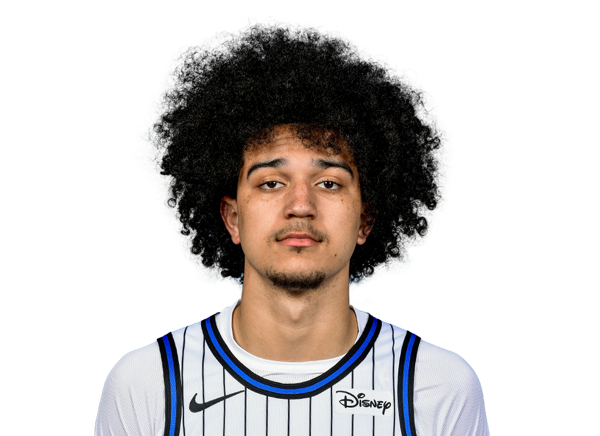
Anthony Black
#11
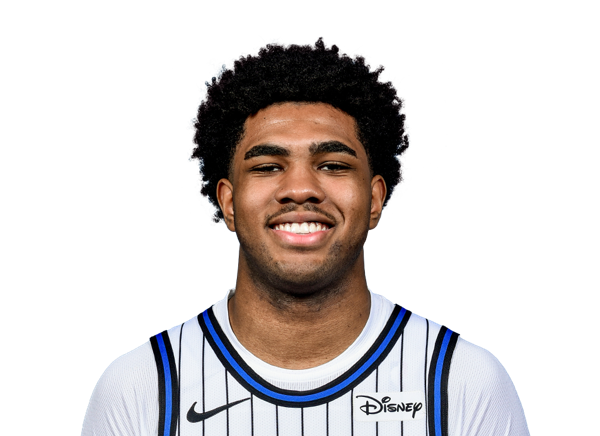
Jase Richardson
#2
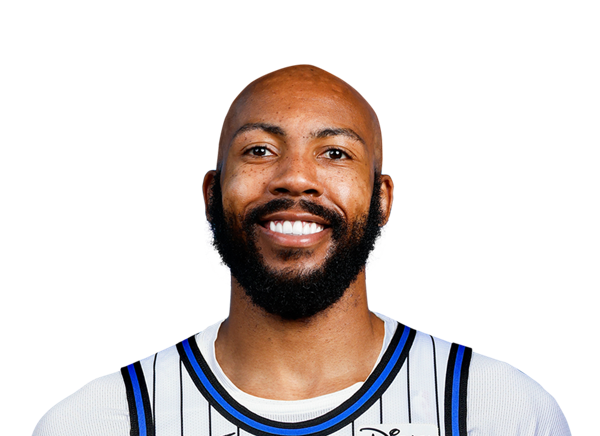
Jevon Carter
#4

Jalen Suggs
#30

Alex Morales
Center
#34
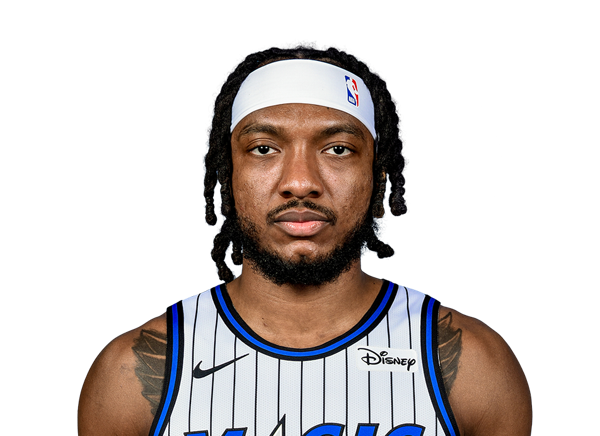
Wendell Carter Jr.
#35
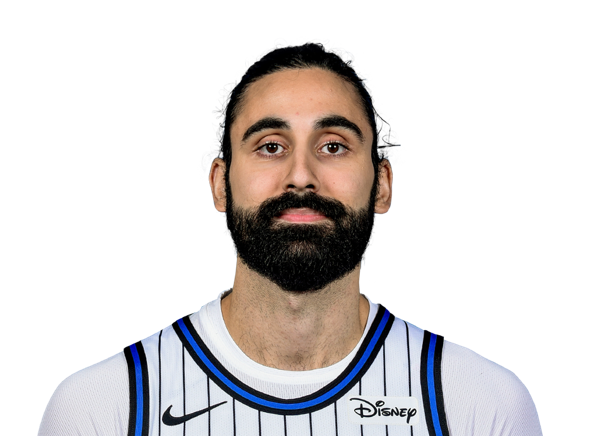
Goga Bitadze
#9

Nikola Vucevic
#14
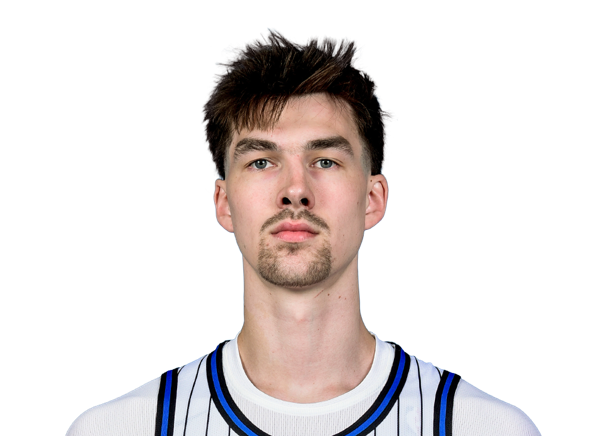
Colin Castleton
Guard
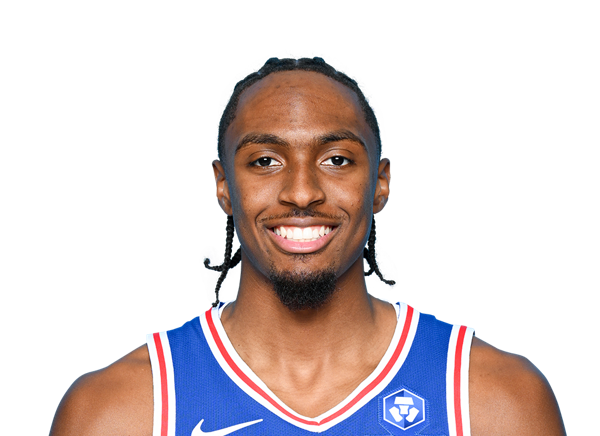
Tyrese Maxey
#7

Jaylen Brown
#77
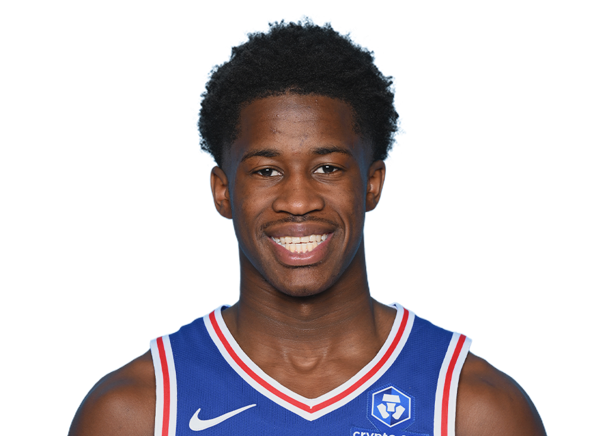
VJ Edgecombe
#5
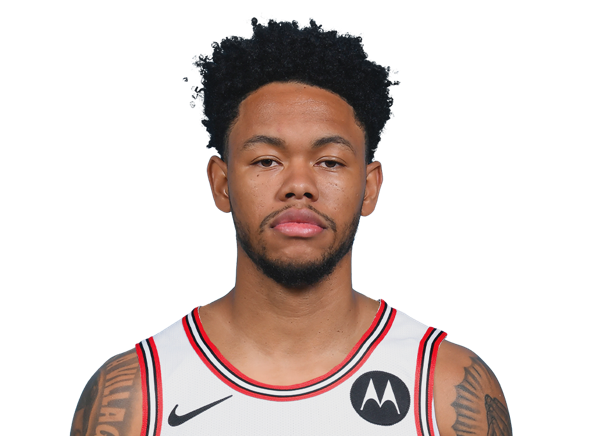
Anfernee Simons
#1

Kentavious Caldwell-Pope
#00

Labaron Philon Jr.
#8

Caleb Love
#12

Rayan Rupert
Center
#21
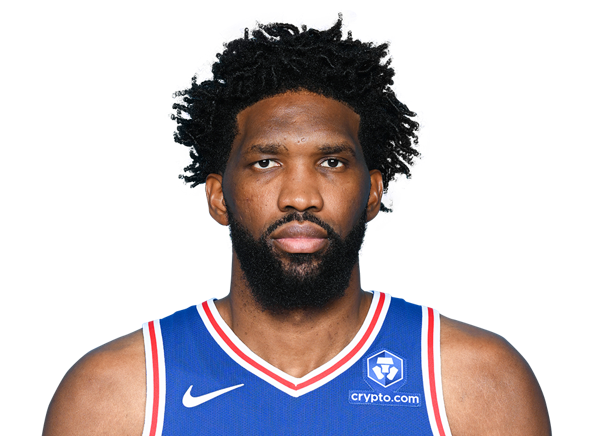
Joel Embiid
#30

Adem Bona
#99
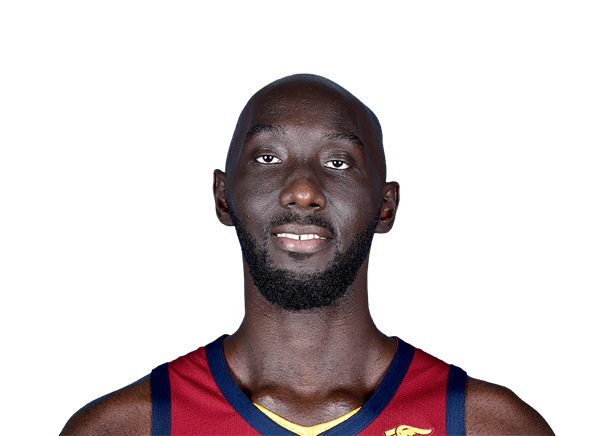
Tacko Fall
#55

Ariel Hukporti
Forward
#23
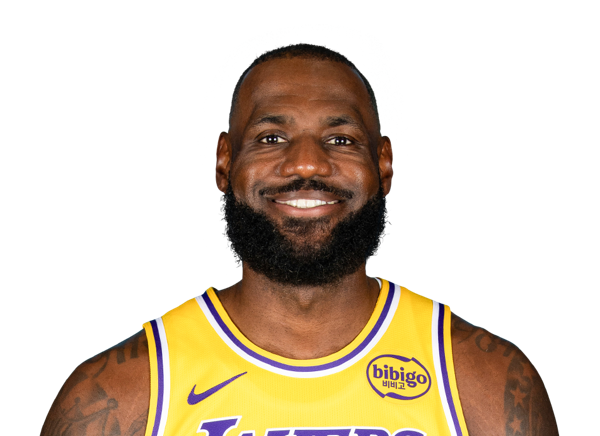
LeBron James
#33
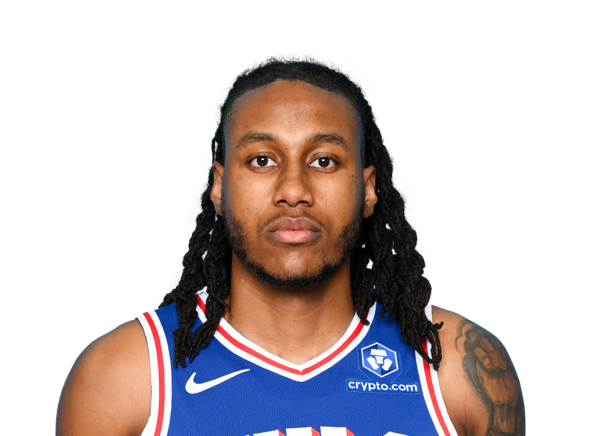
Jabari Walker
#45

Dean Wade
#25

Dominick Barlow
#11
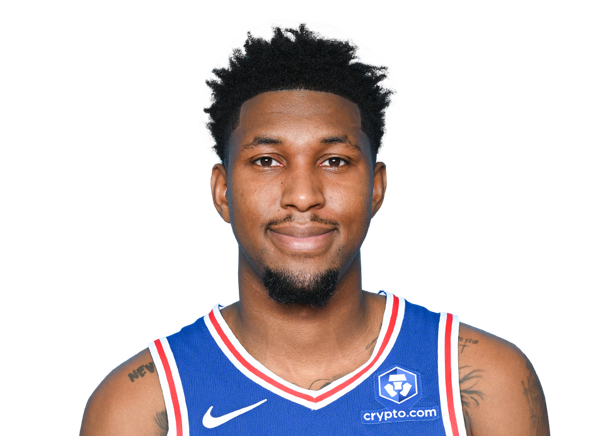
Justin Edwards
Team Statistics
Magic
8th in Eastern Conference Division
VS
76ers
1st in Atlantic Division
General
42.6
Rebounds Per Game
42.8
1.7
Assist To Turnover Ratio
2.3
22.5
Fouls Per Game
20.3
15
Games Played
17
0
Games Started
0
0
Minutes
0
0.0
Minutes Per Game
0.0
639
Rebounds
727
639
Rebounds
727
Offensive
76.5
Free Throw Percentage
80.1
35.8
3-Point Field Goal Percentage
35.3
39.0
Average Field Goals Made
40.8
85.1
Average Field Goals Attempted
87.5
14.5
Average 3-Point Field Goals Made
12.1
40.5
Average 3-Point Field Goals Attempted
34.1
17.1
Average Free Throws Made
21.8
22.4
Average Free Throws Attempted
27.2
109.6
Points Per Game
115.5
10.9
Offensive Rebounds Per Game
9.9
26.5
Assists Per Game
26.6
15.5
Turnovers Per Game
11.6
54.9
2-Point Field Goal Percentage
53.9
1.287
Scoring Efficiency
1.321
0.54
Shooting Efficiency
0.54
45.8
Field Goal Percentage
46.7
368.0
2-Point Field Goals Made
489.0
670.0
2-Point Field Goals Attempted
907.0
1644
Points
1964
163
Offensive Rebounds
169
398
Assists
453
232
Turnovers
197
585
Field Goals Made
694
1277
Field Goals Attempted
1487
257
Free Throws Made
371
336
Free Throws Attempted
463
217
3-Point Field Goals Made
205
607
3-Point Field Goals Attempted
580
35.7
3-Point Field Goal Percentage
35.3
24.5
2-Point Field Goals Made per Game
28.8
44.7
2-Point Field Goals Attempted per Game
53.4
Defensive
31.7
Defensive Rebounds Per Game
32.8
4.3
Blocks Per Game
4.4
7.6
Steals Per Game
7.9
476
Defensive Rebounds
558
114
Steals
135
65
Blocks
74