

Magic vs Pacers Live Score (31 Dec, 2026)
Game Information
League
NBA
Season
1
Date
December 31, 2026
Tipoff
3:00 PM EST
Status
Scheduled
Team Stats
 ORL
Game Comparison
IND
-Points-
-Rebounds-
-Assists-
46Field Goal %47
-3-Point %-
-Free Throw %-
Game Leaders
ORLIND
 —#
Points
—
—#
—#
Rebounds
—
—#
—#
Assists
—
—#
Injury Report
Indiana Pacers
H2H / Season Series
Last 5 Games















Rosters
Magic
8th in Eastern Conference Division
VS
Pacers
3rd in Central Division
Forward
#22
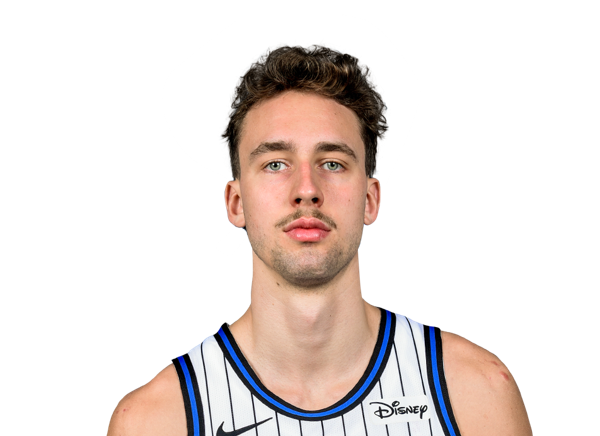
Franz Wagner
#23
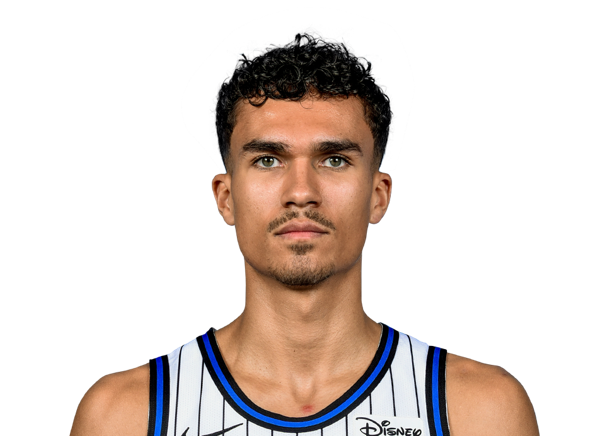
Tristan da Silva
#8

Jamal Cain
#5

Paolo Banchero
#1

Jonathan Isaac
#25
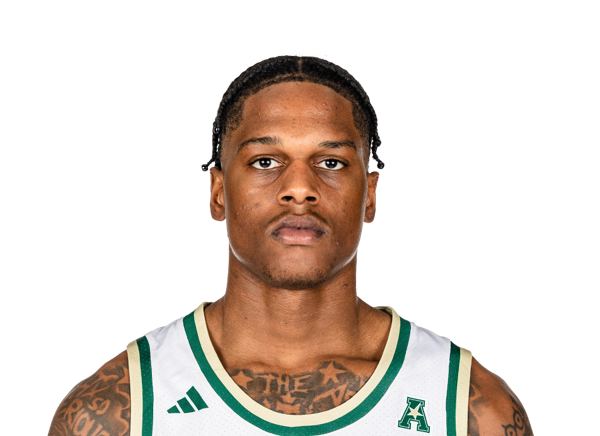
Izaiyah Nelson
#93
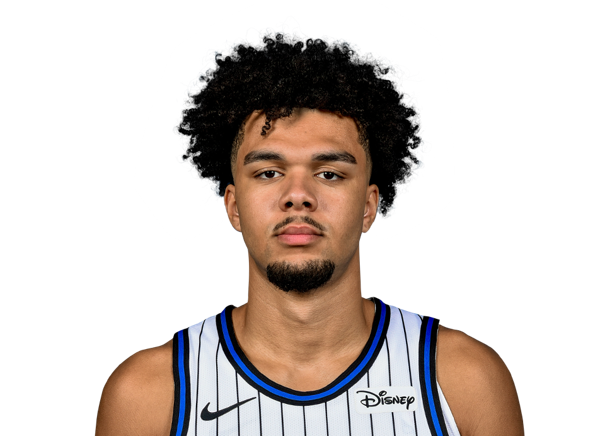
Noah Penda
Guard
#3

Desmond Bane
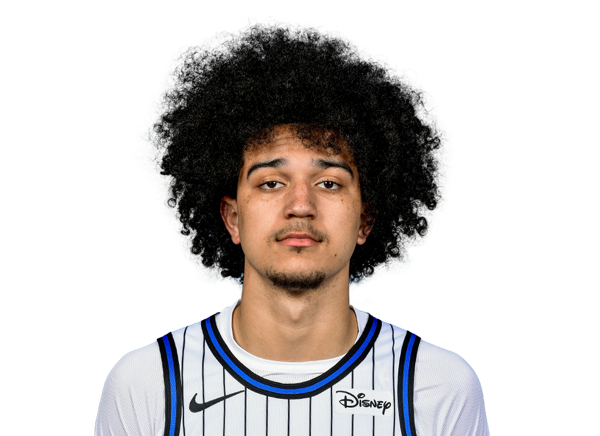
Anthony Black
#11
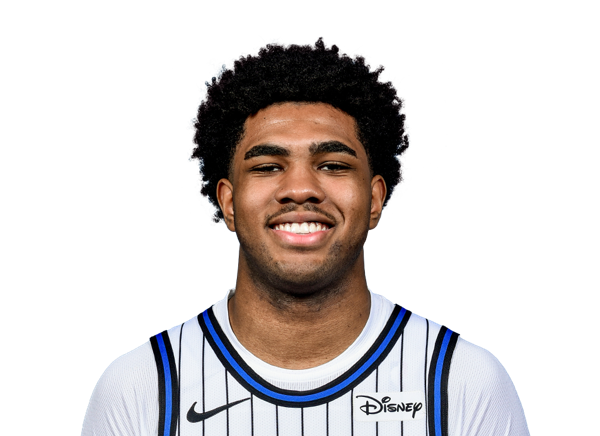
Jase Richardson
#2
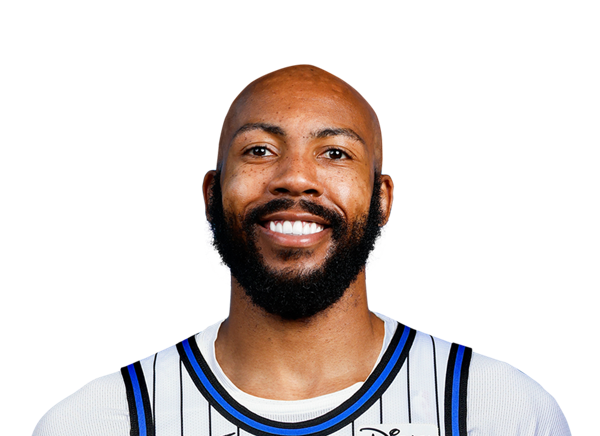
Jevon Carter
#4

Jalen Suggs
#30

Alex Morales
Center
#34
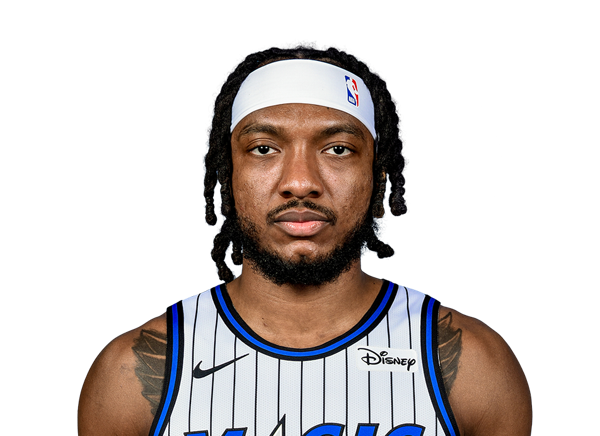
Wendell Carter Jr.
#35
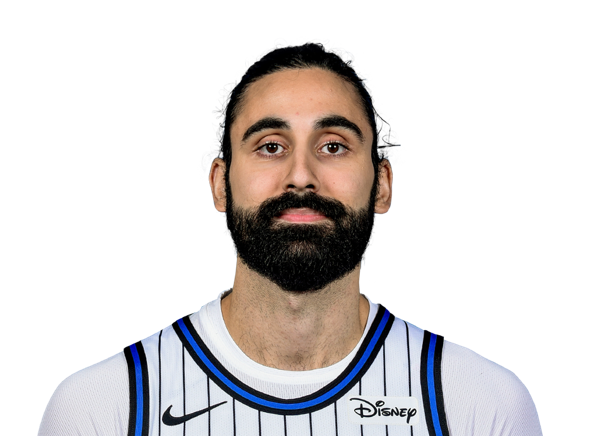
Goga Bitadze
#9

Nikola Vucevic
#14

Colin Castleton
Forward
#43

Pascal Siakam
#1
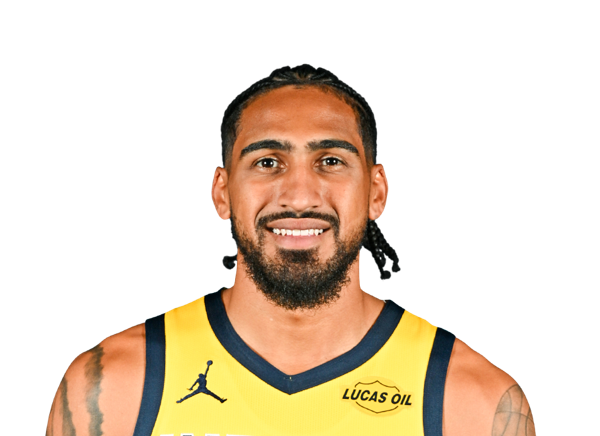
Obi Toppin
#5
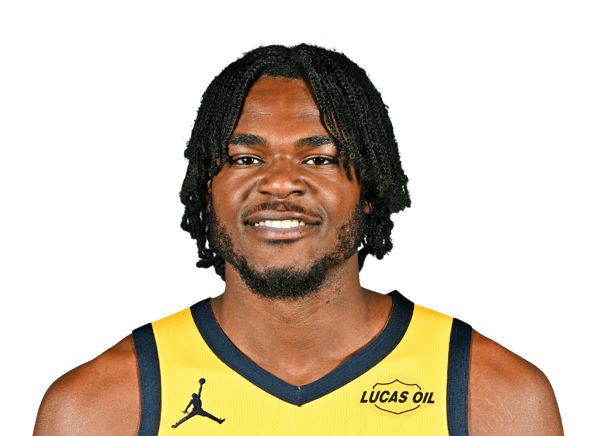
Jarace Walker
#22
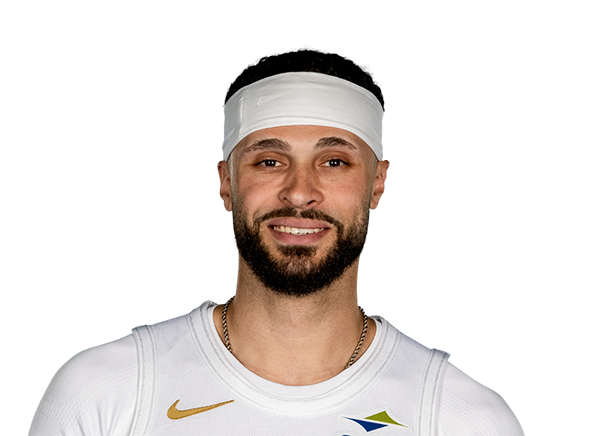
Larry Nance Jr.
#18

Jalen Slawson
Guard
#2

Andrew Nembhard
#10

Kelly Oubre Jr.
#23

Aaron Nesmith
#29
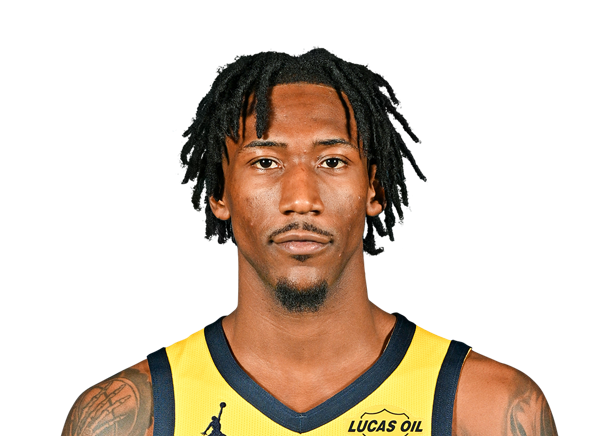
Quenton Jackson
#3

Braden Smith
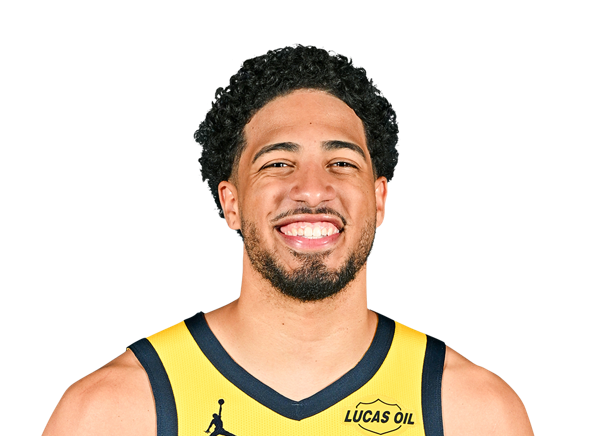
Tyrese Haliburton
#9

T.J. McConnell
#24

Kobe Brown
#26
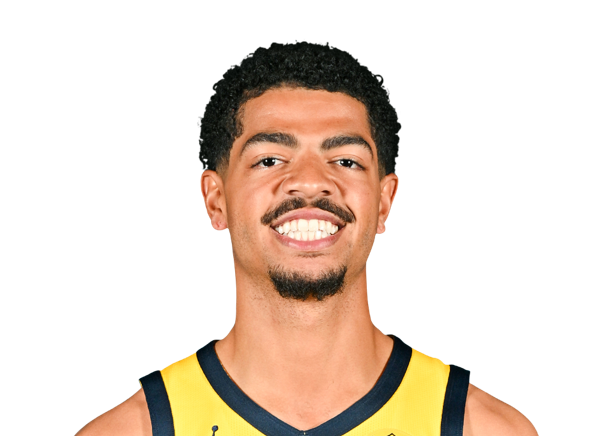
Ben Sheppard
#12

Johnny Furphy
Center
#40
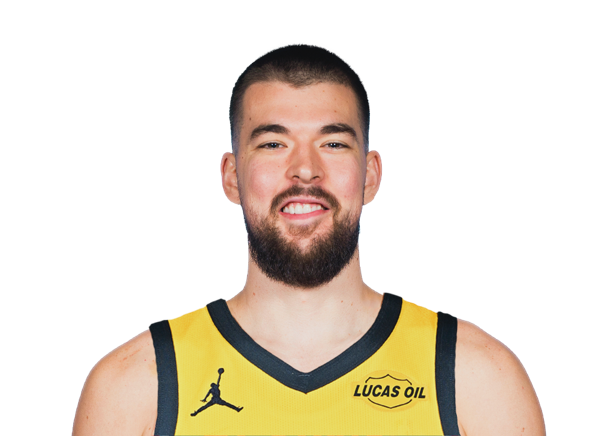
Ivica Zubac
#32

Jay Huff
Team Statistics
Magic
8th in Eastern Conference Division
VS
Pacers
3rd in Central Division
General
42.6
Rebounds Per Game
41.8
1.7
Assist To Turnover Ratio
2.1
22.5
Fouls Per Game
20.1
15
Games Played
16
0
Games Started
0
0
Minutes
0
0.0
Minutes Per Game
0.0
639
Rebounds
668
639
Rebounds
668
Offensive
76.5
Free Throw Percentage
76.1
35.8
3-Point Field Goal Percentage
33.1
39.0
Average Field Goals Made
41.2
85.1
Average Field Goals Attempted
87.2
14.5
Average 3-Point Field Goals Made
11.9
40.5
Average 3-Point Field Goals Attempted
35.9
17.1
Average Free Throws Made
17.8
22.4
Average Free Throws Attempted
23.3
109.6
Points Per Game
112.0
10.9
Offensive Rebounds Per Game
9.4
26.5
Assists Per Game
28.1
15.5
Turnovers Per Game
13.6
54.9
2-Point Field Goal Percentage
57.1
1.287
Scoring Efficiency
1.285
0.54
Shooting Efficiency
0.54
45.8
Field Goal Percentage
47.2
368.0
2-Point Field Goals Made
469.0
670.0
2-Point Field Goals Attempted
821.0
1644
Points
1792
163
Offensive Rebounds
151
398
Assists
449
232
Turnovers
218
585
Field Goals Made
659
1277
Field Goals Attempted
1395
257
Free Throws Made
284
336
Free Throws Attempted
373
217
3-Point Field Goals Made
190
607
3-Point Field Goals Attempted
574
35.7
3-Point Field Goal Percentage
33.1
24.5
2-Point Field Goals Made per Game
29.3
44.7
2-Point Field Goals Attempted per Game
51.3
Defensive
31.7
Defensive Rebounds Per Game
32.3
4.3
Blocks Per Game
4.7
7.6
Steals Per Game
7.5
476
Defensive Rebounds
517
114
Steals
120
65
Blocks
75