

Magic vs Warriors Live Score (8 Nov, 2026)
Game Information
League
NBA
Season
2027
Date
November 7, 2026
Tipoff
8:30 PM EST
Status
Scheduled
ORL Record
2-6
GS Record
6-3
Venue
Chase Center
Location
San Francisco, CA
Arena Type
Indoor
Team Stats
 ORL
Game Comparison
GS

-Points-
-Rebounds-
-Assists-
46Field Goal %46
-3-Point %-
-Free Throw %-
Game Leaders
ORLGS
 —#
Points
—
—#
—#Rebounds
—
—#
—#Assists
—
—#
Injury Report
Golden State Warriors
H2H / Season Series
Last 5 Games



NBA Standings
Eastern Conference — Southeast
| Team | W | L | PCT | GB | STRK |
|---|---|---|---|---|---|
 Atlanta | 6 | 4 | .600 | - | W3 |
 Washington | 4 | 5 | .444 | 1.5 | L2 |
 Miami | 3 | 6 | .333 | 2.5 | L1 |
 Charlotte | 3 | 7 | .300 | 3 | L6 |
| Orlando | 2 | 6 | .250 | 3 | L3 |
Western Conference — Pacific
| Team | W | L | PCT | GB | STRK |
|---|---|---|---|---|---|
 LA Lakers | 8 | 2 | .800 | - | W4 |
| Golden State | 6 | 3 | .667 | 1.5 | W6 |
 Phoenix | 2 | 5 | .286 | 4.5 | W1 |
 LA Clippers | 1 | 7 | .125 | 6 | L7 |
 Sacramento | 1 | 8 | .111 | 6.5 | L2 |
Rosters
Magic
11th in Eastern Conference Division
VS
Warriors
2nd in Pacific Division
Forward
#22
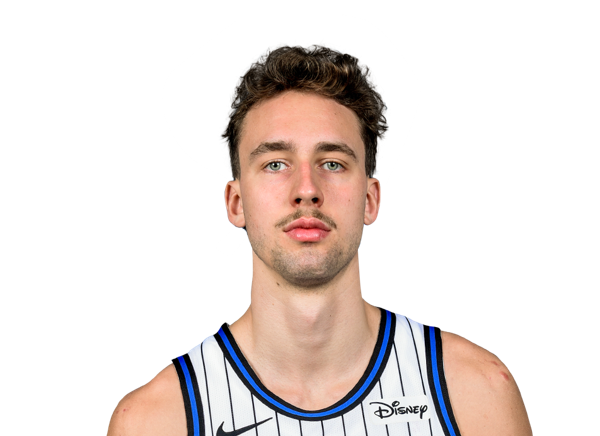
Franz Wagner
#23
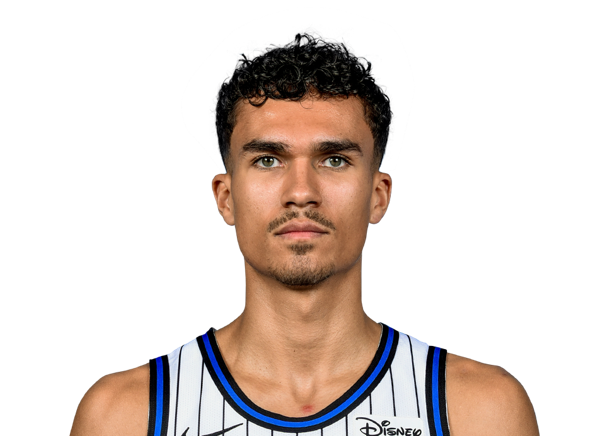
Tristan da Silva
#8

Jamal Cain
#5

Paolo Banchero
#1

Jonathan Isaac
#93
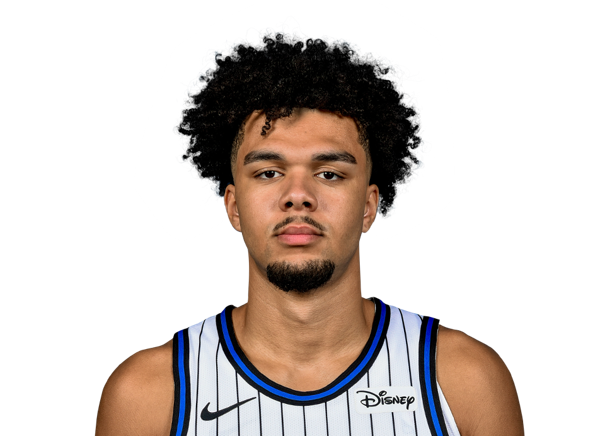
Noah Penda
#25
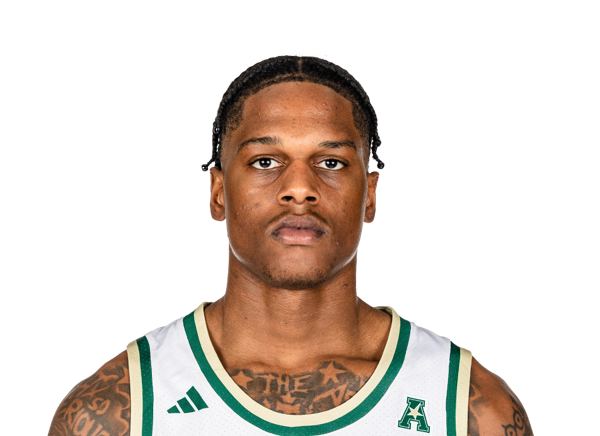
Izaiyah Nelson
Guard
#3

Desmond Bane
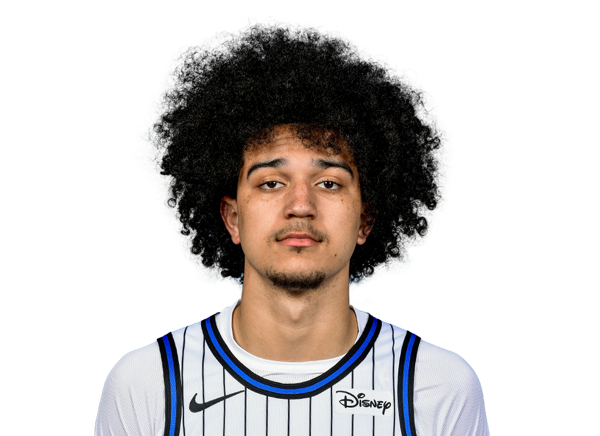
Anthony Black
#11
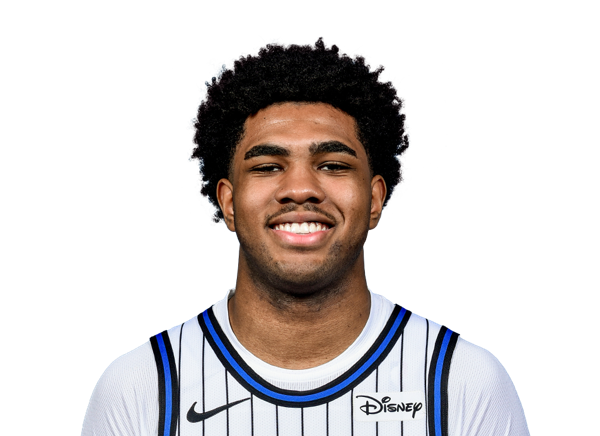
Jase Richardson
#30

Alex Morales
#4

Jalen Suggs
#2
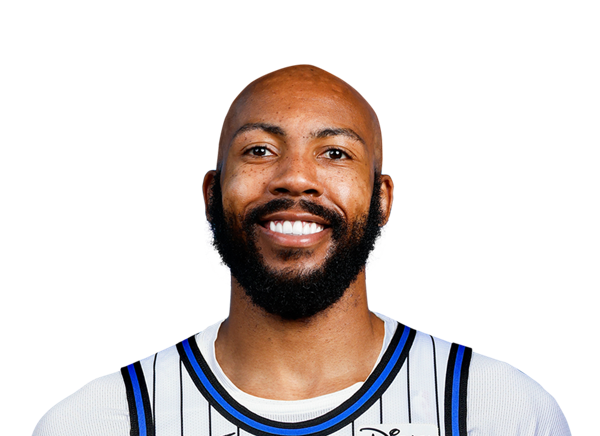
Jevon Carter
Center
#34
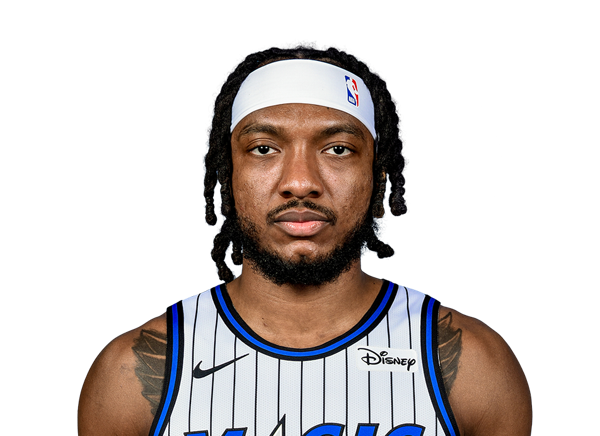
Wendell Carter Jr.
#35
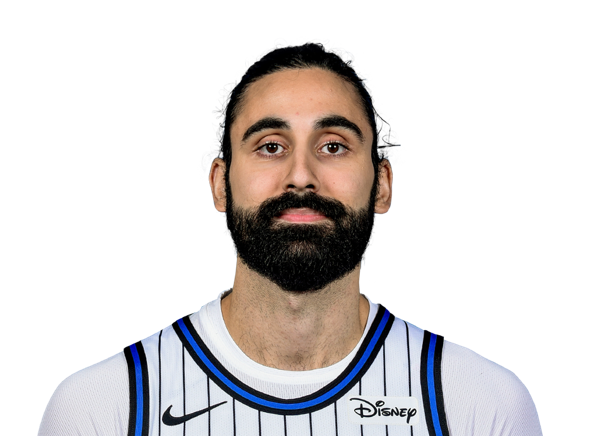
Goga Bitadze
#9
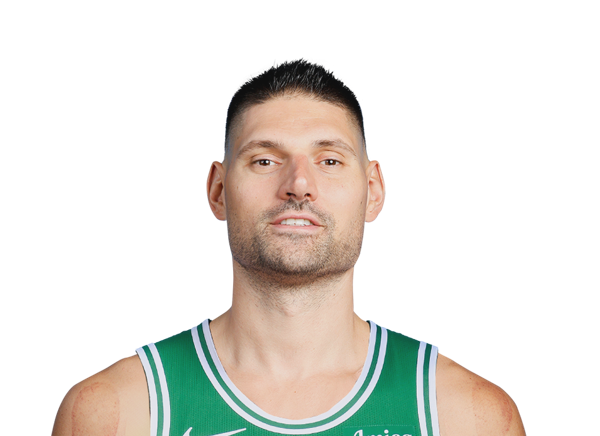
Nikola Vucevic
#14
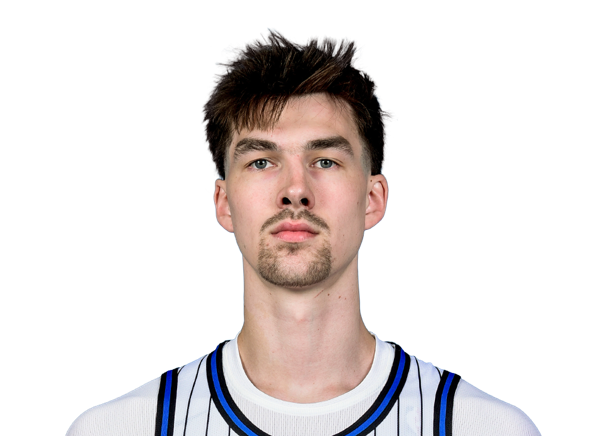
Colin Castleton
Guard
#30

Stephen Curry
#2
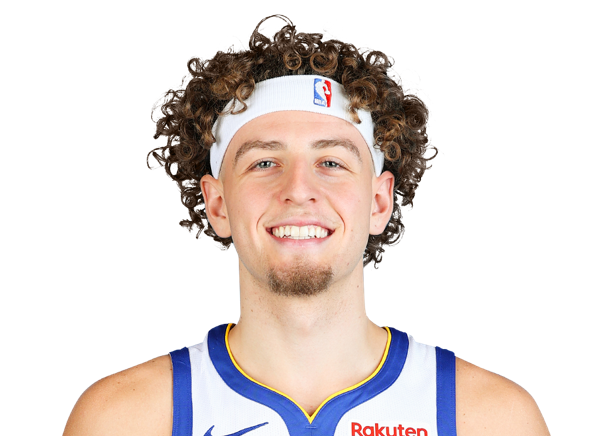
Brandin Podziemski
#12
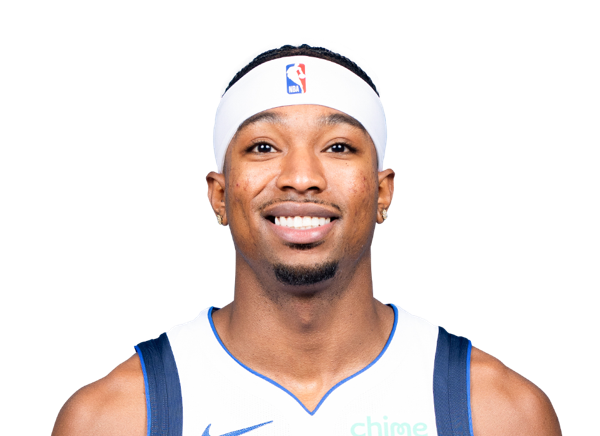
Brandon Williams
#8
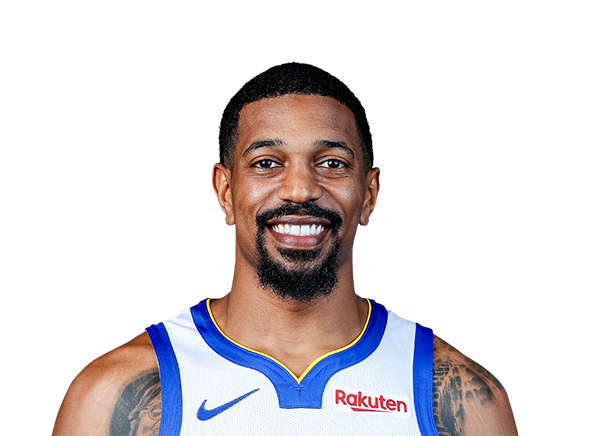
De'Anthony Melton
#3

Will Richard
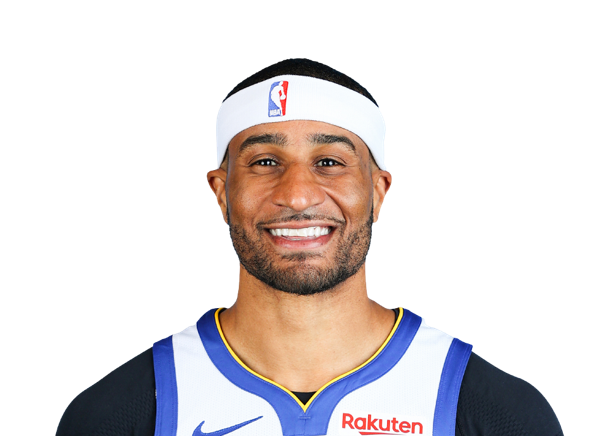
Gary Payton II
#18

LJ Cryer
#4
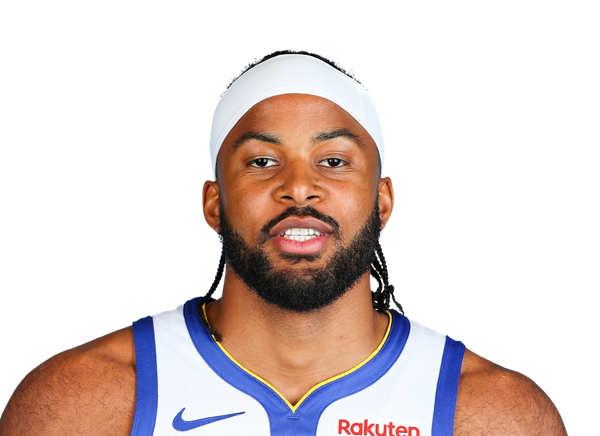
Moses Moody
Forward
#1

Yaxel Lendeborg
#32
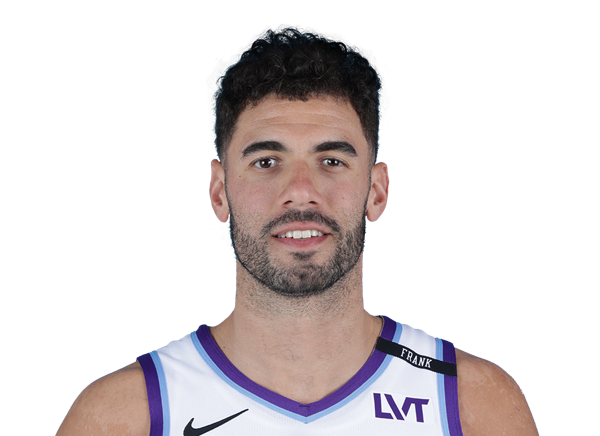
Georges Niang
#15
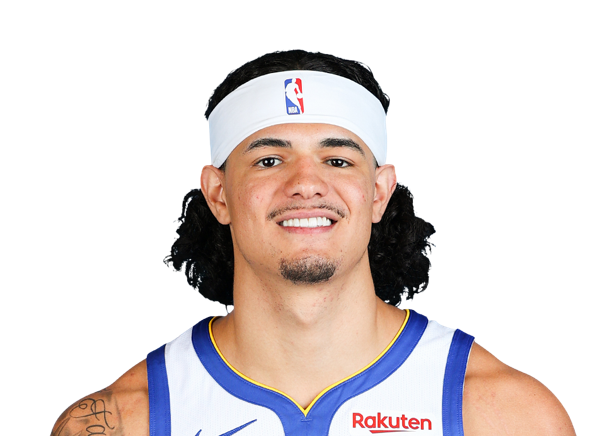
Gui Santos
#45
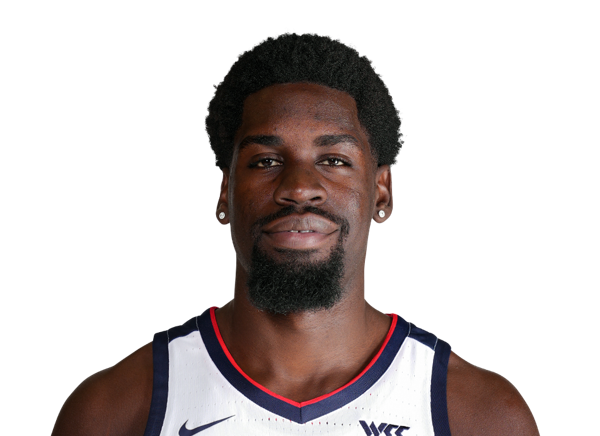
Graham Ike
#23
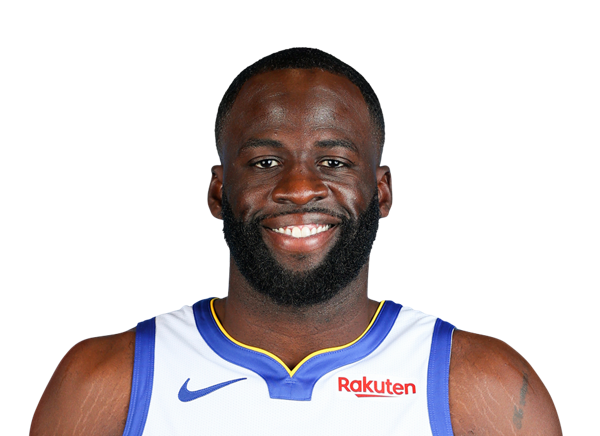
Draymond Green
#33

Malevy Leons
#10
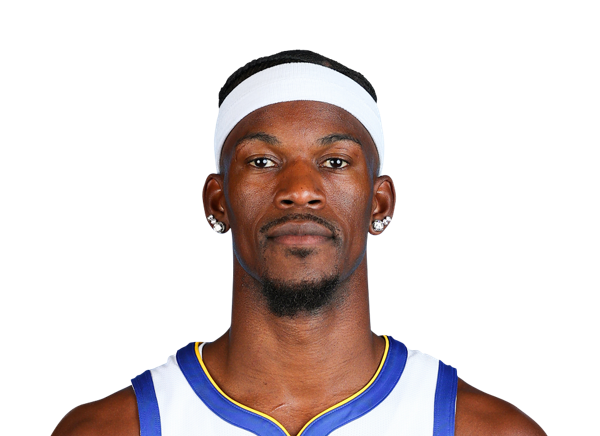
Jimmy Butler III
Center
#28

Charles Bassey
#20
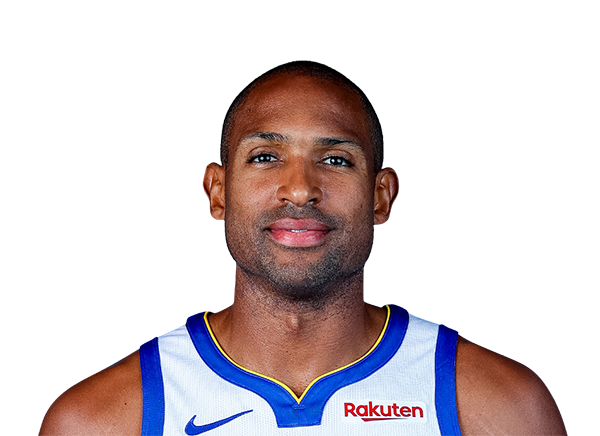
Al Horford
#7
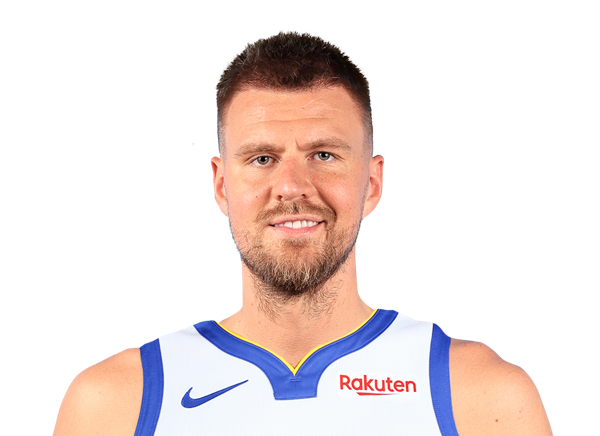
Kristaps Porzingis
Team Statistics
Magic
11th in Eastern Conference Division
VS
Warriors
2nd in Pacific Division
General
40.0
Rebounds Per Game
43.9
1.5
Assist To Turnover Ratio
1.7
22.5
Fouls Per Game
22.2
8
Games Played
9
0
Games Started
0
0
Minutes
0
0.0
Minutes Per Game
0.0
320
Rebounds
395
320
Rebounds
395
Offensive
75.3
Free Throw Percentage
81.6
34.3
3-Point Field Goal Percentage
38.9
37.3
Average Field Goals Made
40.0
81.6
Average Field Goals Attempted
86.6
13.1
Average 3-Point Field Goals Made
16.1
38.3
Average 3-Point Field Goals Attempted
41.4
17.9
Average Free Throws Made
21.7
23.8
Average Free Throws Attempted
26.6
105.5
Points Per Game
117.8
10.0
Offensive Rebounds Per Game
13.7
26.1
Assists Per Game
27.8
17.8
Turnovers Per Game
16.1
55.6
2-Point Field Goal Percentage
53.0
1.292
Scoring Efficiency
1.361
0.54
Shooting Efficiency
0.56
45.6
Field Goal Percentage
46.2
193.0
2-Point Field Goals Made
215.0
347.0
2-Point Field Goals Attempted
406.0
844
Points
1060
80
Offensive Rebounds
123
209
Assists
250
142
Turnovers
145
298
Field Goals Made
360
653
Field Goals Attempted
779
143
Free Throws Made
195
190
Free Throws Attempted
239
105
3-Point Field Goals Made
145
306
3-Point Field Goals Attempted
373
34.3
3-Point Field Goal Percentage
38.9
24.1
2-Point Field Goals Made per Game
23.9
43.4
2-Point Field Goals Attempted per Game
45.1
Defensive
30.0
Defensive Rebounds Per Game
30.2
3.6
Blocks Per Game
4.4
7.1
Steals Per Game
9.1
240
Defensive Rebounds
272
57
Steals
82
29
Blocks
40