

Pelicans vs Magic Live Score (3 Feb, 2027)
Game Information
League
NBA
Season
1
Date
February 2, 2027
Tipoff
7:00 PM EST
Status
Scheduled
Team Stats
 NO
Game Comparison
ORL
-Points-
-Rebounds-
-Assists-
50Field Goal %45
-3-Point %-
-Free Throw %-
Game Leaders
NOORL
 —#
Points
—
—#
—#
Rebounds
—
—#
—#
Assists
—
—#
Injury Report
H2H / Season Series
Last 5 Games





NBA Standings
Western Conference — Southwest
| Team | W | L | PCT | GB | STRK |
|---|---|---|---|---|---|
 Houston | 7 | 1 | .875 | - | W2 |
 Memphis | 6 | 1 | .857 | 0.5 | L1 |
 San Antonio | 5 | 2 | .714 | 1.5 | W5 |
 Dallas | 4 | 3 | .571 | 2.5 | L1 |
| New Orleans | 3 | 4 | .429 | 3.5 | W3 |
Eastern Conference — Southeast
| Team | W | L | PCT | GB | STRK |
|---|---|---|---|---|---|
 Washington | 4 | 3 | .571 | - | W2 |
 Atlanta | 4 | 4 | .500 | 0.5 | W1 |
 Charlotte | 3 | 5 | .375 | 1.5 | L4 |
 Miami | 2 | 5 | .286 | 2 | L1 |
| Orlando | 2 | 5 | .286 | 2 | L2 |
Rosters
Pelicans
13th in Western Conference Division
VS
Magic
8th in Eastern Conference Division
Forward
#1

Zion Williamson
#41
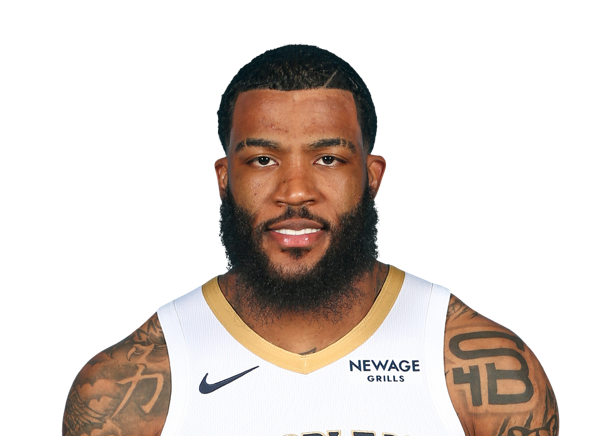
Saddiq Bey
#25

Trey Murphy III
#17

Karlo Matkovic
#2

Herbert Jones
#9
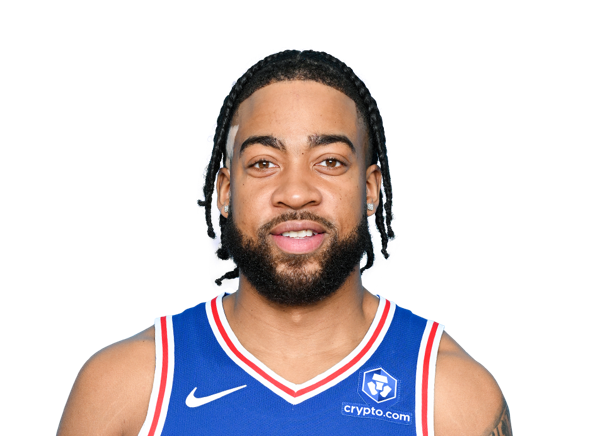
Trendon Watford
#8
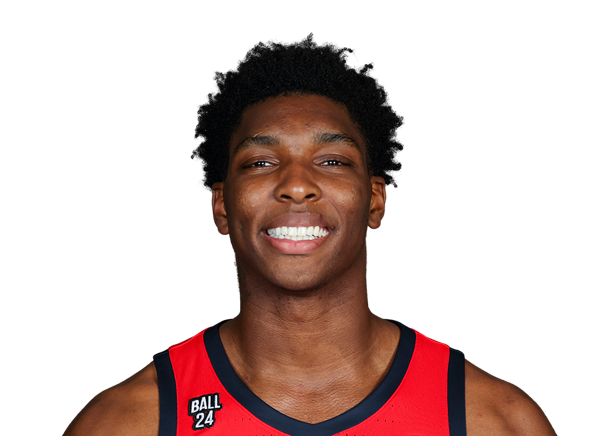
Malik Dia
#13
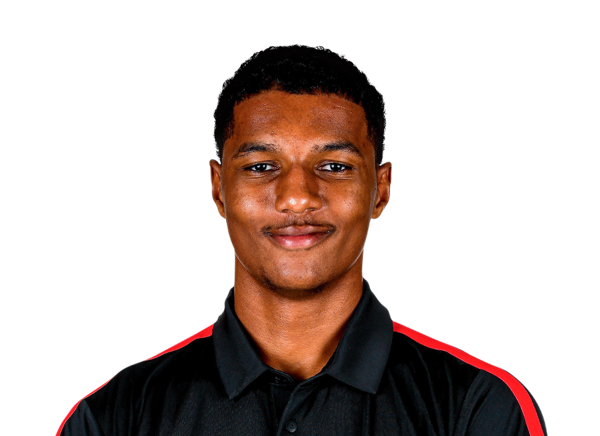
Julian Reese
Guard

Jeremiah Fears
#5

Dejounte Murray
#24
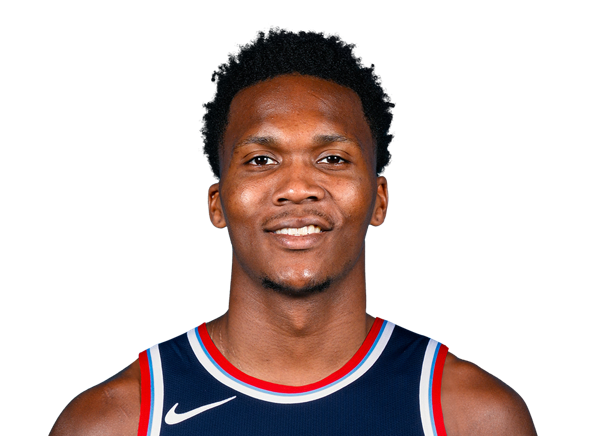
Bennedict Mathurin
#3

Jordan Poole
#10

Jaron Pierre Jr.
#11

Bryce McGowens
#14
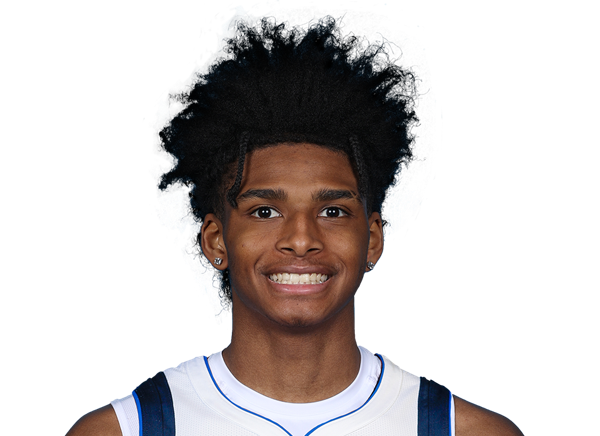
AJ Johnson
Center
#22
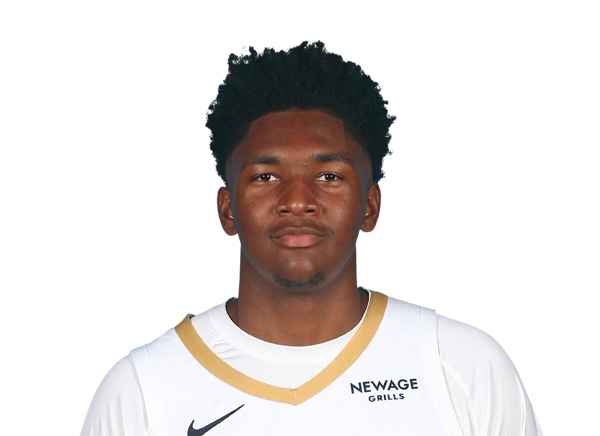
Derik Queen
#21
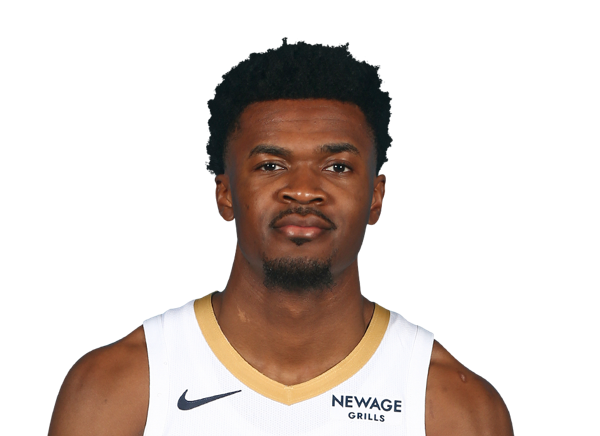
Yves Missi
#6

DeAndre Jordan
Forward
#22
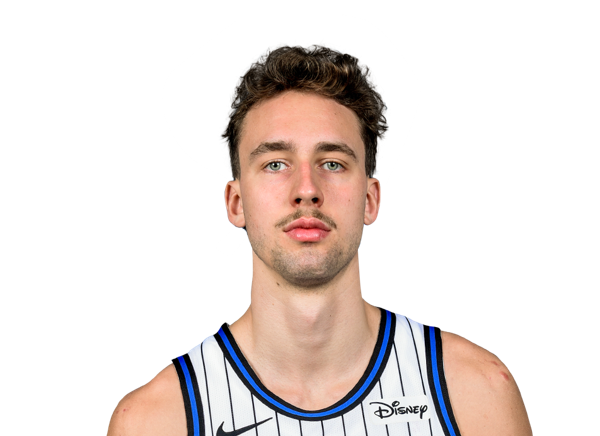
Franz Wagner
#23
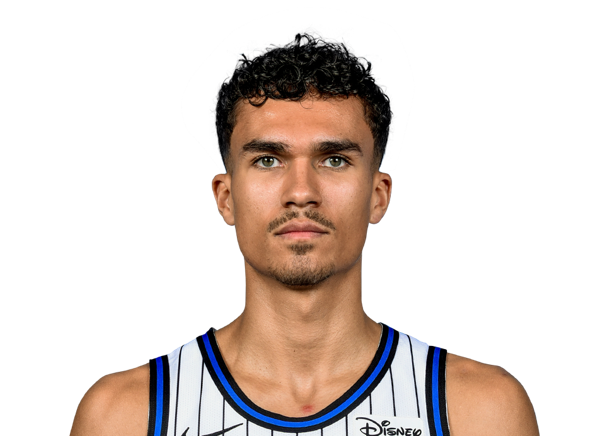
Tristan da Silva
#8

Jamal Cain
#5

Paolo Banchero
#1

Jonathan Isaac
#93
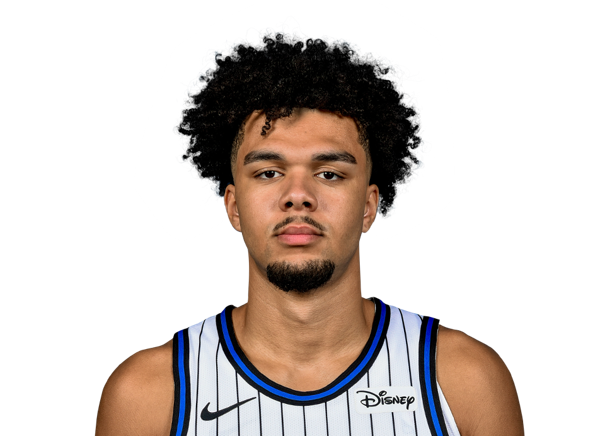
Noah Penda
#25
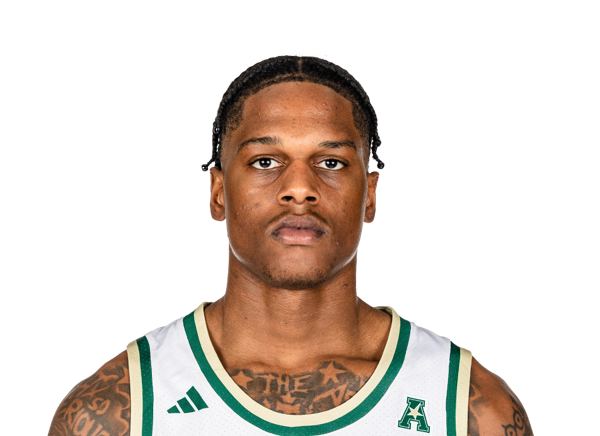
Izaiyah Nelson
Guard
#3

Desmond Bane
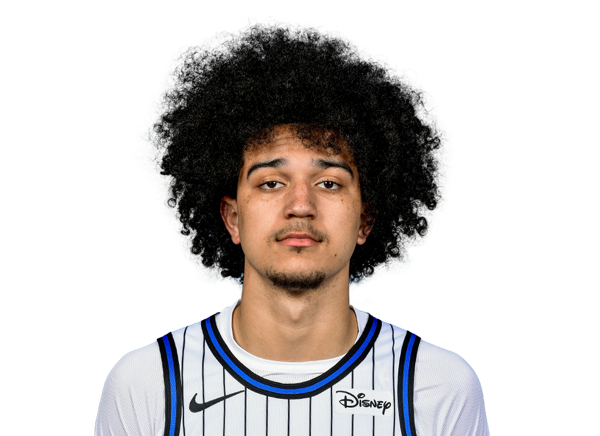
Anthony Black
#11
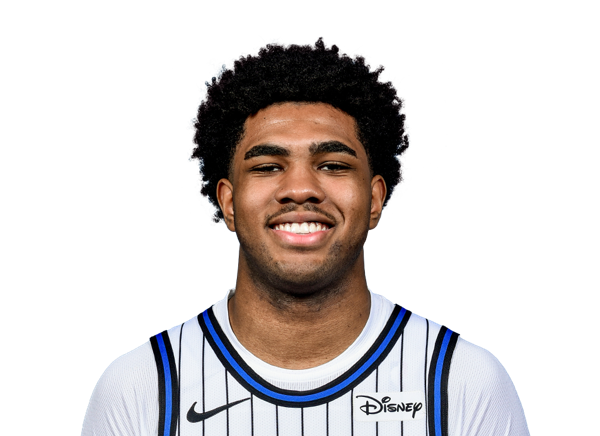
Jase Richardson
#2
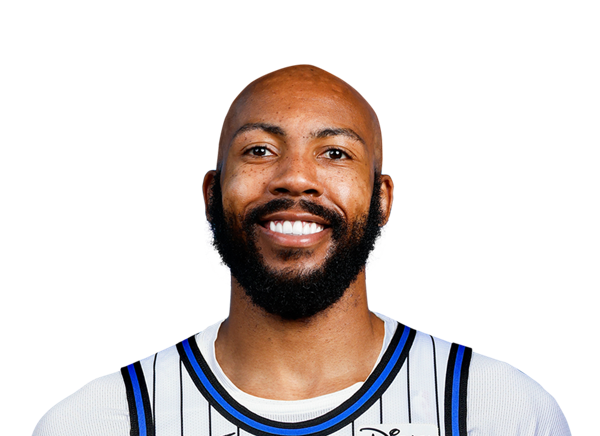
Jevon Carter
#30

Alex Morales
#4

Jalen Suggs
Center
#34
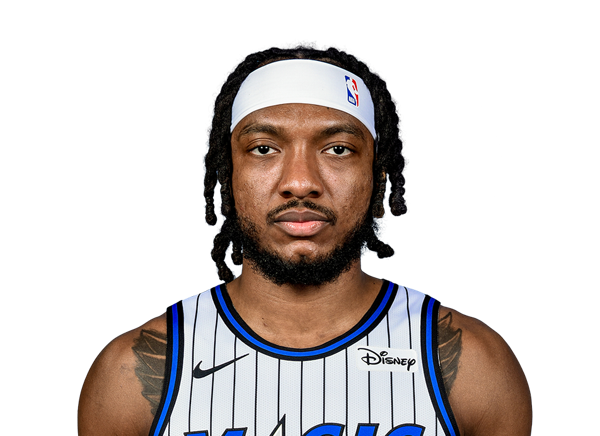
Wendell Carter Jr.
#35
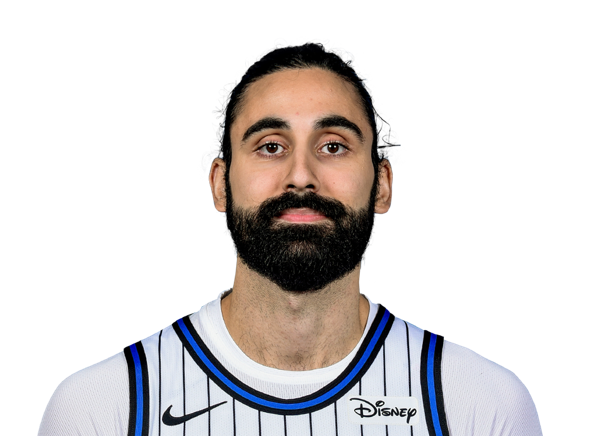
Goga Bitadze
#9

Nikola Vucevic
#14
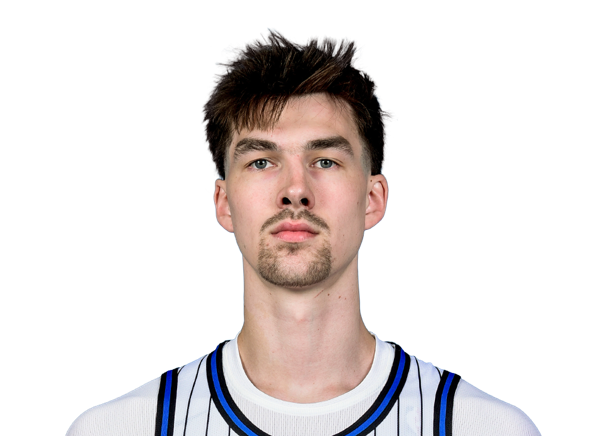
Colin Castleton
Team Statistics
Pelicans
13th in Western Conference Division
VS
Magic
8th in Eastern Conference Division
General
41.1
Rebounds Per Game
42.9
1.6
Assist To Turnover Ratio
1.6
24.6
Fouls Per Game
22.8
14
Games Played
12
0
Games Started
0
0
Minutes
0
0.0
Minutes Per Game
0.0
575
Rebounds
515
575
Rebounds
515
Offensive
82.0
Free Throw Percentage
78.2
32.8
3-Point Field Goal Percentage
33.7
40.1
Average Field Goals Made
38.4
86.2
Average Field Goals Attempted
85.8
9.4
Average 3-Point Field Goals Made
13.8
28.7
Average 3-Point Field Goals Attempted
41.1
26.3
Average Free Throws Made
17.7
32.1
Average Free Throws Attempted
22.6
115.9
Points Per Game
108.3
10.6
Offensive Rebounds Per Game
11.0
24.3
Assists Per Game
26.0
15.5
Turnovers Per Game
16.0
53.3
2-Point Field Goal Percentage
54.9
1.344
Scoring Efficiency
1.262
0.52
Shooting Efficiency
0.53
46.5
Field Goal Percentage
44.8
429.0
2-Point Field Goals Made
295.0
805.0
2-Point Field Goals Attempted
537.0
1622
Points
1300
148
Offensive Rebounds
132
340
Assists
312
217
Turnovers
192
561
Field Goals Made
461
1207
Field Goals Attempted
1030
368
Free Throws Made
212
449
Free Throws Attempted
271
132
3-Point Field Goals Made
166
402
3-Point Field Goals Attempted
493
32.8
3-Point Field Goal Percentage
33.7
30.6
2-Point Field Goals Made per Game
24.6
57.5
2-Point Field Goals Attempted per Game
44.8
Defensive
30.5
Defensive Rebounds Per Game
31.9
5.3
Blocks Per Game
4.1
9.9
Steals Per Game
7.4
427
Defensive Rebounds
383
138
Steals
89
74
Blocks
49