

Flyers vs Capitals Live Score (12 Apr, 2022)
Score by Period
| Team | 1st | 2nd | 3rd | Total |
|---|---|---|---|---|
 PHI | 1 | 0 | 1 | 2 |
 WSH | 3 | 2 | 4 | 9 |
Play-by-Play
3rd Period 20:00
2–9
3rd Period 20:00
2–9
3rd Period 19:57
2–9
3rd Period 19:31
2–9
3rd Period 19:31
2–9
3rd Period 19:30
2–9
3rd Period 19:02
2–9
3rd Period 19:01
2–9
3rd Period 18:42
2–9
3rd Period 18:42
2–9
3rd Period 18:10
2–9
3rd Period 17:53
2–9
3rd Period 17:53
2–9
3rd Period 17:32
2–9
3rd Period 17:32
2–9
3rd Period 16:58
2–8
3rd Period 16:26
2–8
3rd Period 16:26
2–8
3rd Period 16:25
1–8
3rd Period 16:19
1–8
3rd Period 15:00
1–8
3rd Period 15:00
1–8
3rd Period 15:00
1–8
3rd Period 14:40
1–8
Scoring Summary
1st Period
6:01
Alex Ovechkin
Assists: Conor Sheary, Evgeny Kuznetsov
0 - 1
11:24
T.J. Oshie
Assists: John Carlson, Nicklas Backstrom
0 - 2
12:00
James van Riemsdyk
1 - 2
13:16
Martin Fehervary
Assists: Garnet Hathaway, Nic Dowd
1 - 3
2nd Period
6:39
Lars Eller
Assists: Anthony Mantha, Tom Wilson
1 - 4
15:30
Conor Sheary
Assists: Alex Ovechkin, Evgeny Kuznetsov
1 - 5
3rd Period
3:31
Matt Irwin
Assists: Justin Schultz, Johan Larsson
1 - 6
5:59
Lars Eller
Assists: Trevor van Riemsdyk, Anthony Mantha
1 - 7
12:42
Garnet Hathaway
Assists: Matt Irwin, Justin Schultz
1 - 8
16:26
James van Riemsdyk
Assists: Kevin Hayes, Bobby Brink
2 - 8
17:32
Johan Larsson
Assists: Nic Dowd, Justin Schultz
2 - 9
Team Stats
PHI
WSH

15
Blocked Shots
14
24
Hits
17
5
Takeaways
13
6
Giveaways
8
1
Power Play Goals
1
2
Power Play Opportunities
4
21
Total Shots
37
28
Penalty Minutes
16
50.0
Power Play %
25.0
0
Short Handed Goals
0
0
Shootout Goals
0
26
Faceoffs Won
32
44.8
Faceoff Percent
55.2
6
Penalties
4
Game Leaders
PHI
WSH
Player Box Score
Flyers| Player | BS | HT | TK | +/- | TOI | PPTOI | SHTOI | ESTOI | SHFT | G | YTDG | A | S | SM | SOG | FW | FL | FO% | GV | PN | PIM |
|---|---|---|---|---|---|---|---|---|---|---|---|---|---|---|---|---|---|---|---|---|---|
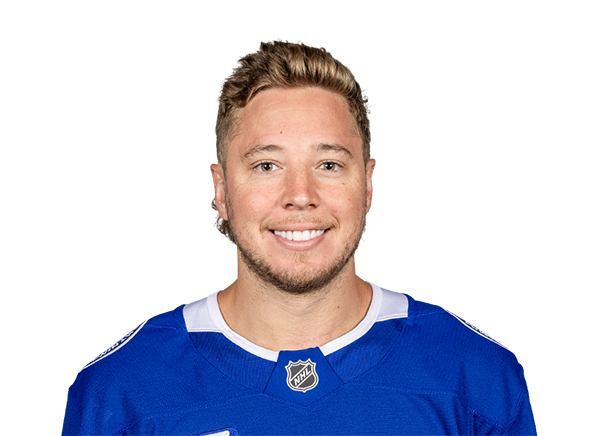 Cam Atkinson#89 · RW | 1 | 0 | 0 | -1 | 5:08 | 0:00 | 0:38 | 4:30 | 8 | 0 | 23 | 0 | 2 | 0 | 0 | 0 | 0 | 0.0 | 0 | 0 | 0 |
 Bobby Brink#46 · RW | 2 | 2 | 0 | 0 | 14:27 | 2:15 | 0:00 | 12:12 | 22 | 0 | 0 | 1 | 2 | 1 | 0 | 0 | 0 | 0.0 | 0 | 0 | 0 |
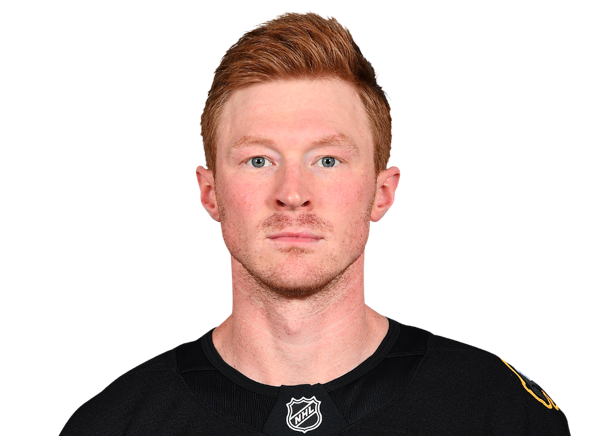 Patrick Brown#38 · C | 0 | 2 | 0 | -4 | 14:31 | 0:00 | 3:03 | 11:28 | 24 | 0 | 4 | 0 | 1 | 1 | 0 | 5 | 2 | 71.4 | 2 | 0 | 0 |
 Noah Cates#49 · LW | 0 | 2 | 1 | -2 | 14:19 | 0:00 | 1:13 | 13:06 | 23 | 0 | 2 | 0 | 1 | 0 | 0 | 0 | 0 | 0.0 | 0 | 0 | 0 |
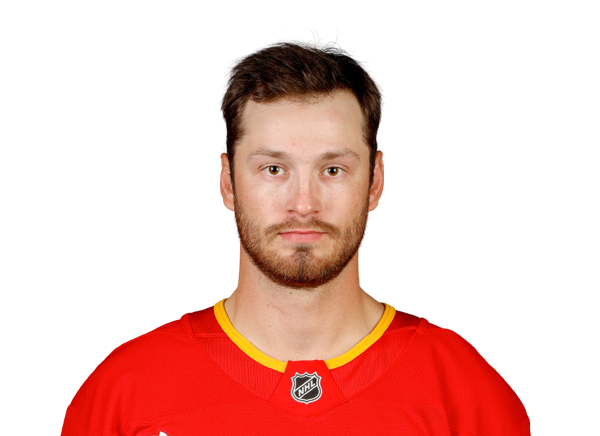 Joel Farabee#86 · LW | 0 | 1 | 0 | -4 | 14:54 | 0:51 | 1:10 | 12:53 | 21 | 0 | 16 | 0 | 0 | 0 | 0 | 0 | 0 | 0.0 | 0 | 3 | 14 |
 Morgan Frost#48 · C | 1 | 0 | 1 | 1 | 15:51 | 1:10 | 0:11 | 14:30 | 21 | 0 | 3 | 0 | 0 | 2 | 0 | 4 | 6 | 40.0 | 1 | 0 | 0 |
 Kevin Hayes#13 · RW | 0 | 0 | 1 | -4 | 17:58 | 2:16 | 0:38 | 15:04 | 25 | 0 | 8 | 1 | 4 | 0 | 0 | 5 | 11 | 31.3 | 0 | 0 | 0 |
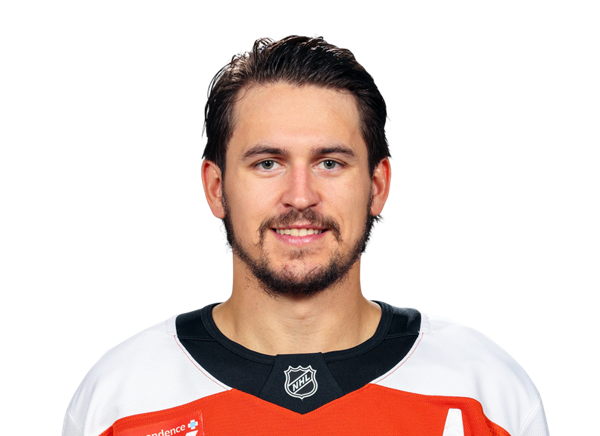 Travis Konecny#11 · RW | 1 | 0 | 0 | 0 | 14:55 | 0:52 | 0:02 | 14:01 | 21 | 0 | 13 | 0 | 1 | 0 | 0 | 0 | 1 | 0.0 | 0 | 1 | 10 |
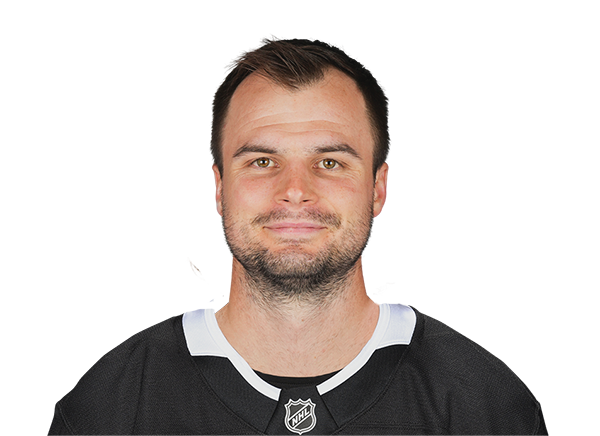 Scott Laughton#21 · C | 0 | 4 | 0 | -2 | 16:44 | 1:01 | 1:03 | 14:40 | 24 | 0 | 11 | 0 | 0 | 0 | 0 | 5 | 8 | 38.5 | 0 | 0 | 0 |
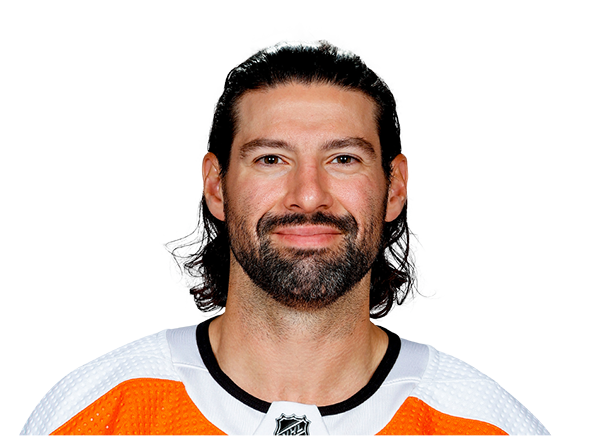 Nate Thompson#44 · C | 1 | 1 | 0 | -4 | 13:49 | 0:00 | 2:57 | 10:52 | 24 | 0 | 1 | 0 | 1 | 0 | 0 | 7 | 4 | 63.6 | 0 | 0 | 0 |
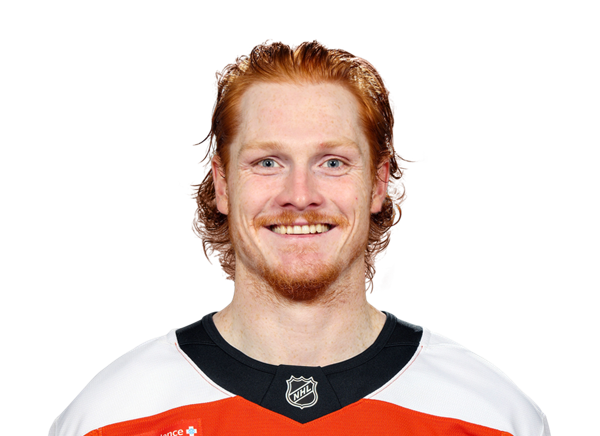 Owen Tippett#74 · RW | 0 | 0 | 0 | -2 | 15:10 | 1:11 | 0:00 | 13:59 | 21 | 0 | 8 | 0 | 1 | 0 | 0 | 0 | 0 | 0.0 | 0 | 0 | 0 |
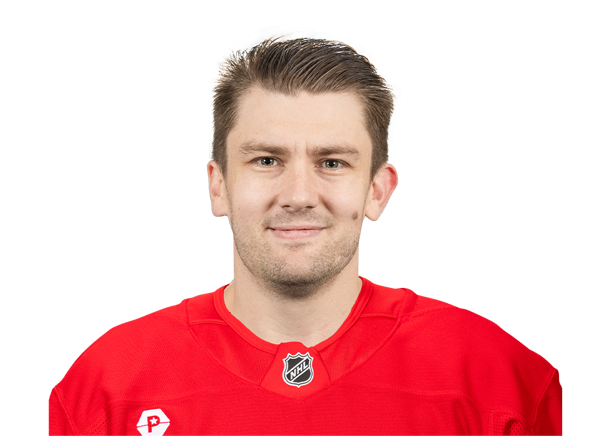 James van Riemsdyk#25 · LW | 1 | 0 | 0 | 1 | 17:27 | 2:34 | 0:00 | 14:53 | 25 | 2 | 20 | 0 | 2 | 0 | 0 | 0 | 0 | 0.0 | 0 | 0 | 0 |
Capitals| Player | BS | HT | TK | +/- | TOI | PPTOI | SHTOI | ESTOI | SHFT | G | YTDG | A | S | SM | SOG | FW | FL | FO% | GV | PN | PIM |
|---|---|---|---|---|---|---|---|---|---|---|---|---|---|---|---|---|---|---|---|---|---|
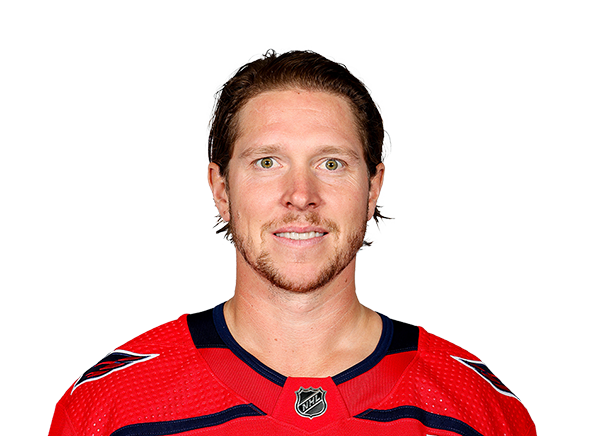 Nicklas Backstrom#19 · C | 0 | 0 | 1 | 1 | 14:05 | 1:01 | 0:00 | 13:04 | 17 | 0 | 6 | 1 | 1 | 0 | 0 | 4 | 5 | 44.4 | 0 | 0 | 0 |
 Nic Dowd#26 · C | 2 | 1 | 1 | 3 | 15:27 | 1:15 | 2:15 | 11:57 | 19 | 0 | 8 | 2 | 2 | 0 | 0 | 11 | 4 | 73.3 | 0 | 0 | 0 |
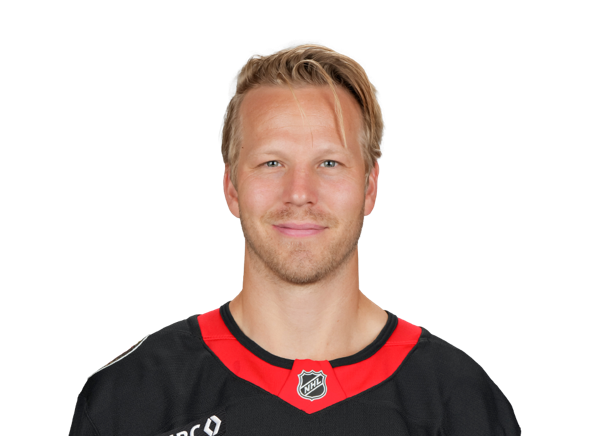 Lars Eller#20 · C | 1 | 0 | 0 | 1 | 15:24 | 2:20 | 0:33 | 12:31 | 20 | 2 | 12 | 0 | 5 | 1 | 0 | 8 | 5 | 61.5 | 0 | 0 | 0 |
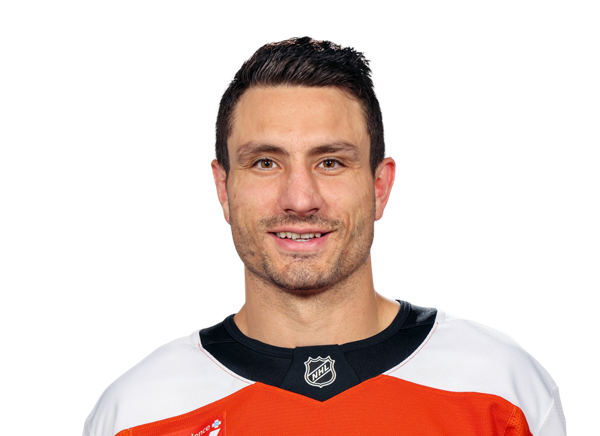 Garnet Hathaway#21 · RW | 0 | 2 | 0 | 3 | 13:37 | 1:24 | 0:36 | 11:37 | 17 | 1 | 12 | 1 | 1 | 1 | 0 | 0 | 0 | 0.0 | 0 | 0 | 0 |
 Marcus Johansson#90 · LW | 1 | 2 | 0 | 1 | 17:07 | 1:54 | 0:00 | 15:13 | 18 | 0 | 7 | 0 | 2 | 0 | 0 | 2 | 1 | 66.7 | 0 | 0 | 0 |
 Evgeny Kuznetsov#92 · C | 1 | 0 | 1 | 2 | 15:23 | 1:01 | 0:38 | 13:44 | 18 | 0 | 23 | 2 | 3 | 0 | 0 | 6 | 9 | 40.0 | 2 | 1 | 10 |
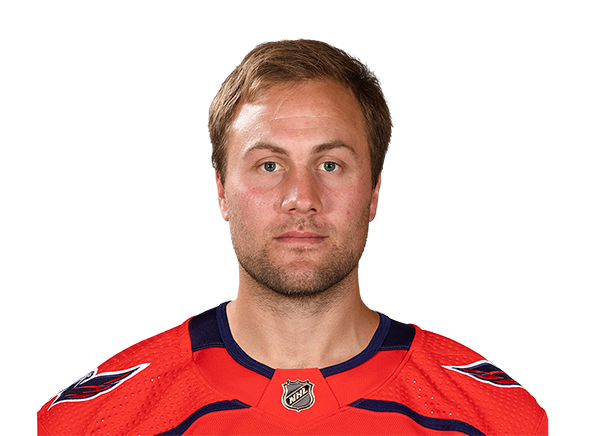 Johan Larsson#22 · LW | 0 | 2 | 1 | 2 | 13:35 | 1:23 | 0:49 | 11:23 | 15 | 1 | 7 | 1 | 2 | 1 | 0 | 0 | 1 | 0.0 | 0 | 0 | 0 |
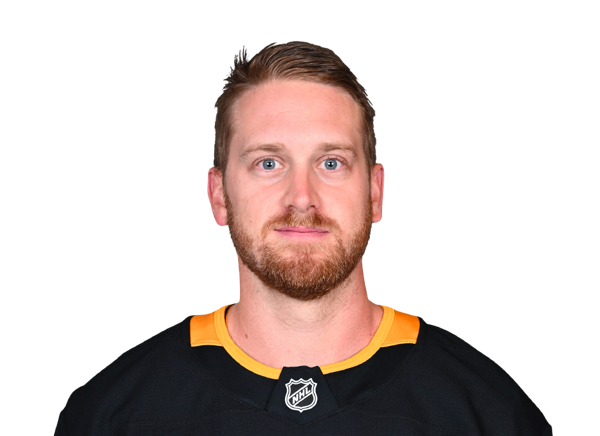 Anthony Mantha#39 · RW | 0 | 1 | 1 | 1 | 13:19 | 2:50 | 0:00 | 10:29 | 17 | 0 | 7 | 2 | 3 | 1 | 0 | 0 | 0 | 0.0 | 1 | 0 | 0 |
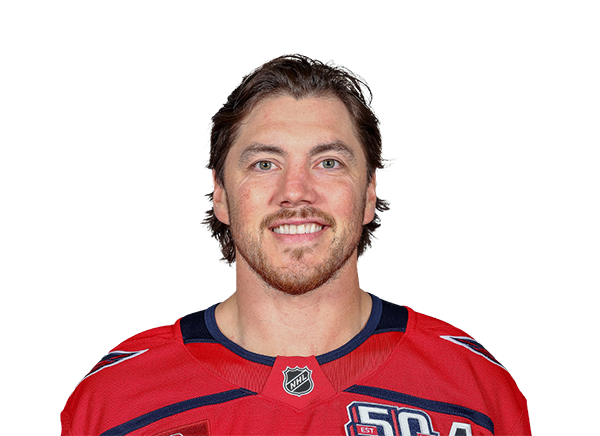 T.J. Oshie#77 · RW | 3 | 2 | 2 | 1 | 15:14 | 1:03 | 0:00 | 14:11 | 18 | 1 | 9 | 0 | 1 | 0 | 0 | 1 | 0 | 100.0 | 0 | 1 | 2 |
 Alex Ovechkin#8 · LW | 1 | 0 | 2 | 3 | 18:42 | 4:48 | 0:00 | 13:54 | 18 | 1 | 46 | 1 | 3 | 2 | 0 | 0 | 0 | 0.0 | 0 | 0 | 0 |
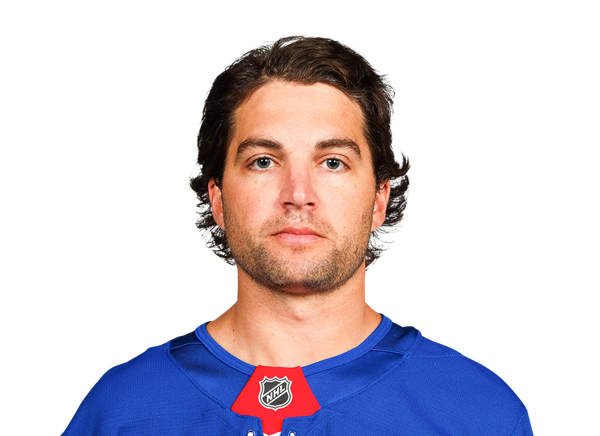 Conor Sheary#73 · LW | 0 | 0 | 1 | 2 | 16:39 | 0:13 | 0:35 | 15:51 | 20 | 1 | 17 | 1 | 2 | 0 | 0 | 0 | 0 | 0.0 | 0 | 0 | 0 |
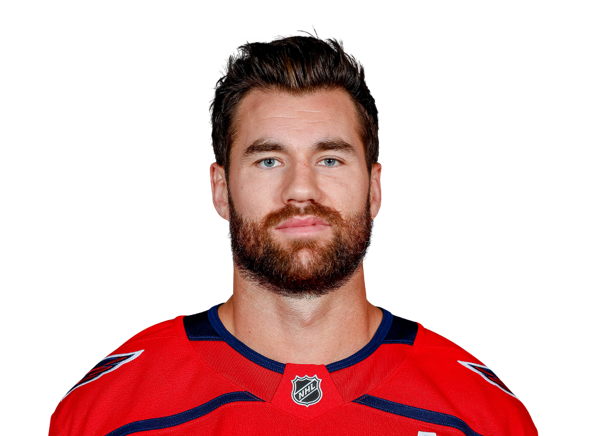 Tom Wilson#43 · RW | 0 | 2 | 1 | 1 | 12:26 | 2:03 | 0:00 | 10:23 | 17 | 0 | 23 | 1 | 1 | 2 | 0 | 0 | 1 | 0.0 | 0 | 1 | 2 |
Flyers| Player | BS | HT | TK | +/- | TOI | PPTOI | SHTOI | ESTOI | SHFT | G | YTDG | A | S | SM | SOG | FW | FL | FO% | GV | PN | PIM |
|---|---|---|---|---|---|---|---|---|---|---|---|---|---|---|---|---|---|---|---|---|---|
 Ronnie Attard#47 · D | 0 | 3 | 0 | -5 | 13:24 | 0:00 | 0:40 | 12:44 | 19 | 0 | 1 | 0 | 1 | 1 | 0 | 0 | 0 | 0.0 | 1 | 0 | 0 |
 Kevin Connauton#8 · D | 0 | 4 | 0 | -5 | 15:24 | 0:00 | 1:41 | 13:43 | 24 | 0 | 1 | 0 | 1 | 0 | 0 | 0 | 0 | 0.0 | 1 | 0 | 0 |
 Ivan Provorov#9 · D | 0 | 2 | 1 | -3 | 23:17 | 0:59 | 3:49 | 18:29 | 30 | 0 | 8 | 0 | 1 | 2 | 0 | 0 | 0 | 0.0 | 0 | 0 | 0 |
 Rasmus Ristolainen#70 · D | 0 | 1 | 0 | 0 | 21:28 | 0:11 | 1:07 | 20:10 | 27 | 0 | 2 | 0 | 1 | 0 | 0 | 0 | 0 | 0.0 | 0 | 1 | 2 |
 Travis Sanheim#6 · D | 7 | 2 | 1 | 1 | 23:43 | 0:08 | 2:55 | 20:40 | 29 | 0 | 7 | 0 | 0 | 0 | 0 | 0 | 0 | 0.0 | 1 | 0 | 0 |
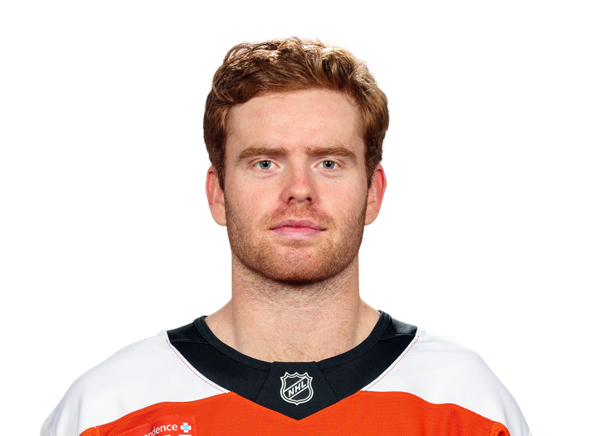 Cam York#45 · D | 1 | 0 | 0 | -2 | 19:42 | 2:16 | 0:49 | 16:37 | 23 | 0 | 3 | 0 | 2 | 1 | 0 | 0 | 0 | 0.0 | 0 | 1 | 2 |
Capitals| Player | BS | HT | TK | +/- | TOI | PPTOI | SHTOI | ESTOI | SHFT | G | YTDG | A | S | SM | SOG | FW | FL | FO% | GV | PN | PIM |
|---|---|---|---|---|---|---|---|---|---|---|---|---|---|---|---|---|---|---|---|---|---|
 John Carlson#74 · D | 1 | 0 | 1 | 2 | 17:44 | 1:01 | 0:48 | 15:55 | 21 | 0 | 14 | 1 | 2 | 0 | 0 | 0 | 0 | 0.0 | 0 | 0 | 0 |
 Martin Fehervary#42 · D | 2 | 4 | 0 | 3 | 19:40 | 0:13 | 0:50 | 18:37 | 23 | 1 | 8 | 0 | 3 | 0 | 0 | 0 | 0 | 0.0 | 2 | 0 | 0 |
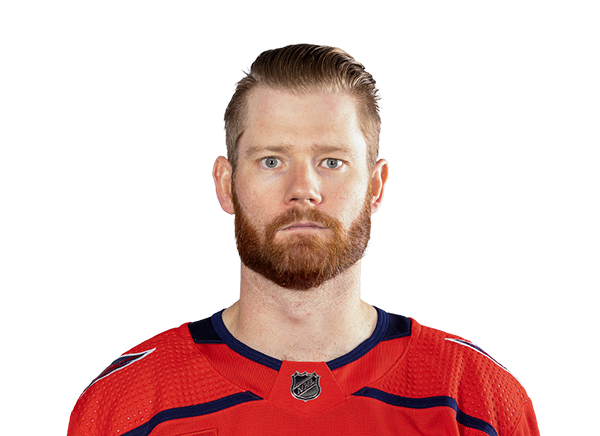 Matt Irwin#52 · D | 0 | 1 | 0 | 2 | 18:17 | 0:09 | 0:00 | 18:08 | 22 | 1 | 1 | 1 | 3 | 3 | 0 | 0 | 0 | 0.0 | 0 | 0 | 0 |
 Nick Jensen#3 · D | 0 | 0 | 0 | 3 | 19:50 | 0:00 | 2:36 | 17:14 | 22 | 0 | 5 | 0 | 0 | 1 | 0 | 0 | 0 | 0.0 | 1 | 0 | 0 |
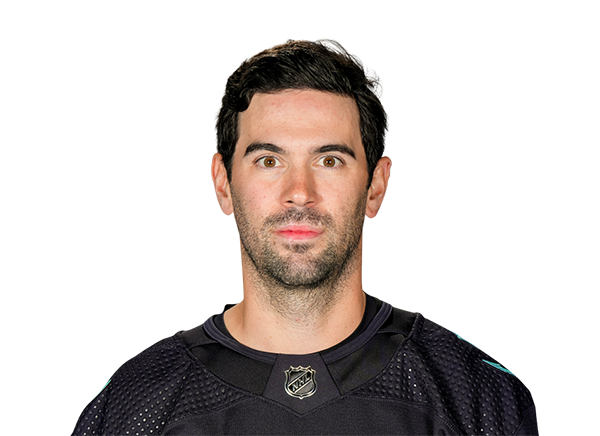 Justin Schultz#2 · D | 1 | 0 | 1 | 2 | 19:22 | 3:11 | 0:00 | 16:11 | 24 | 0 | 2 | 3 | 1 | 0 | 0 | 0 | 0 | 0.0 | 1 | 1 | 2 |
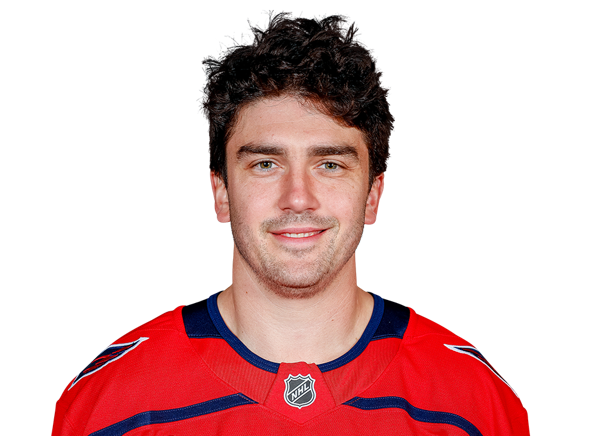 Trevor van Riemsdyk#57 · D | 1 | 0 | 0 | 2 | 19:20 | 1:36 | 2:38 | 15:06 | 23 | 0 | 1 | 1 | 2 | 0 | 0 | 0 | 0 | 0.0 | 0 | 0 | 0 |
Flyers| Player | GA | SA | SOS | SOSA | SV | SV% | ESSV | PPSV | SHSV | TOI | YTDG | PIM |
|---|---|---|---|---|---|---|---|---|---|---|---|---|
 Carter Hart#79 · G | 3 | 10 | 0 | 0 | 7 | .700 | 4 | 0 | 3 | 20:00 | 0 | 0 |
 Martin Jones#35 · G | 6 | 27 | 0 | 0 | 21 | .778 | 19 | 0 | 2 | 40:00 | 0 | 0 |
Capitals| Player | GA | SA | SOS | SOSA | SV | SV% | ESSV | PPSV | SHSV | TOI | YTDG | PIM |
|---|---|---|---|---|---|---|---|---|---|---|---|---|
 Ilya Samsonov#30 · G | 2 | 21 | 0 | 0 | 19 | .905 | 17 | 1 | 1 | 59:03 | 0 | 0 |
Injury Report
Head-to-Head
PHILast 5 Games
WSH
2◂
NHL Regular Season
FINAL
Feb 26, 2022
1
3
NHL Regular Season
FINAL
Feb 17, 2022
▸5
0
NHL Regular Season
FINAL
Dec 21, 2021
0
2◂
NHL Regular Season
FINAL
Nov 6, 2021
1
1
NHL Regular Season
FINAL
May 8, 2021
▸2
Last 5 Games





Game Information
Stage
Regular Season
Season
2022
Puck Drop
Tue, Apr 12, 7:00 PM
Venue
Capital One Arena
Location
Washington, DC
Attendance
18,573
Officials
Jon McIsaac · Referee, Libor Suchanek · Linesman, Mitch Dunning · Referee, Ben O'Quinn · Linesman
Division Standings
Eastern Conference — Metropolitan Division
| Team | GP | W | L | OT | Pct | PTS | DIFF | Strk |
|---|---|---|---|---|---|---|---|---|
 Hurricanes | 82 | 53 | 22 | 7 | — | 113 | +56 | W1 |
 Penguins | 82 | 41 | 25 | 16 | — | 98 | +25 | L3 |
| Flyers | 82 | 43 | 27 | 12 | — | 98 | +7 | W3 |
| Capitals | 82 | 43 | 30 | 9 | — | 95 | +19 | W4 |
 Blue Jackets | 82 | 40 | 30 | 12 | — | 92 | 0 | L2 |
 Islanders | 82 | 43 | 34 | 5 | — | 91 | -8 | L3 |
 Devils | 82 | 42 | 37 | 3 | — | 87 | -24 | L1 |
 Rangers | 82 | 34 | 39 | 9 | — | 77 | -12 | W1 |
Flyers
14th in Eastern Conference
VS
Capitals
9th in Eastern Conference
Goaltenders
#80

Dan Vladar
#53
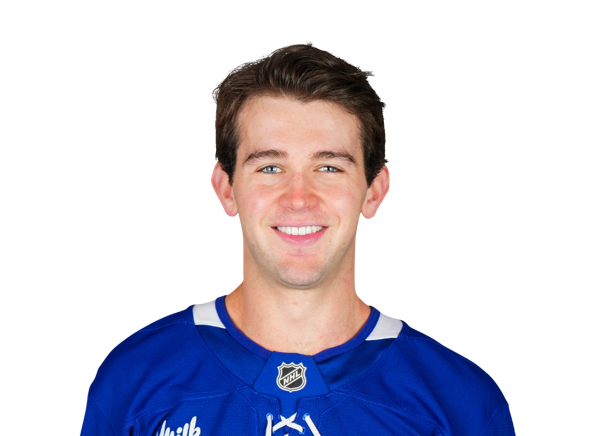
Joseph Woll
Defensemen
#44
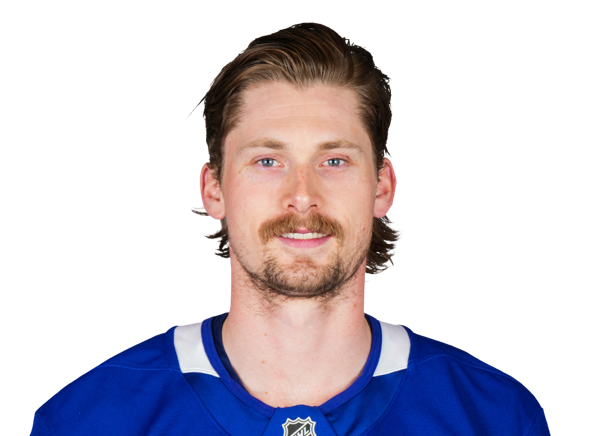
Simon Benoit
#59
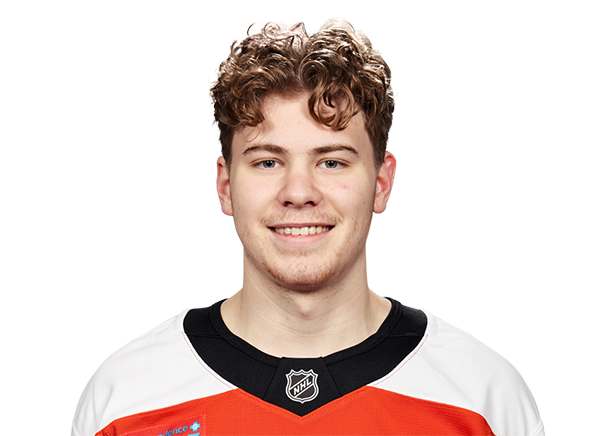
Oliver Bonk
#9

Jamie Drysdale
#3

Helge Grans
#5

David Jiricek
#55
Rasmus Ristolainen
#6
Travis Sanheim
#24

Nick Seeler
#8
Cam York
Left Wings
#20

Alex Bump
#58

Michael Bunting
#27
Noah Cates
Centers
#52

Noel Acciari
#86
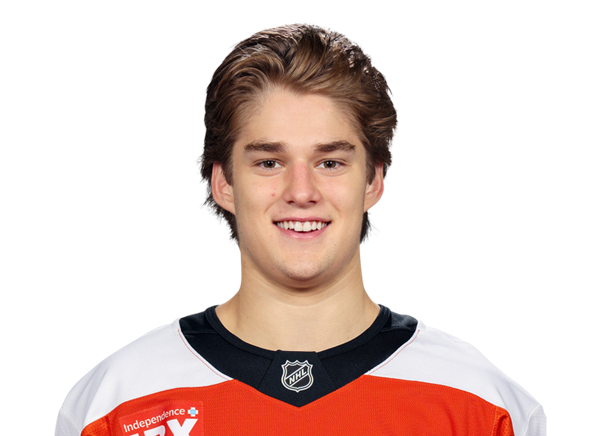
Denver Barkey
#14

Sean Couturier
#22

Christian Dvorak
#17

Jett Luchanko
#46

Trevor Zegras
Right Wings
#71
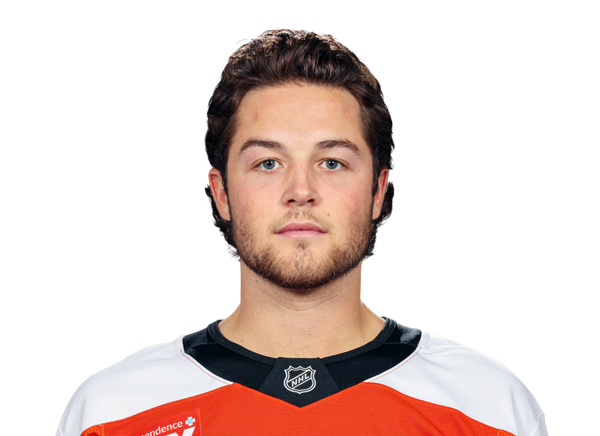
Tyson Foerster
#54

Cole Knuble
#11
Travis Konecny
#94
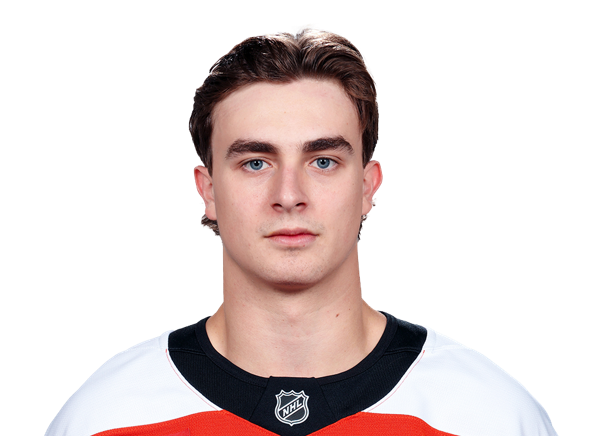
Porter Martone
#39
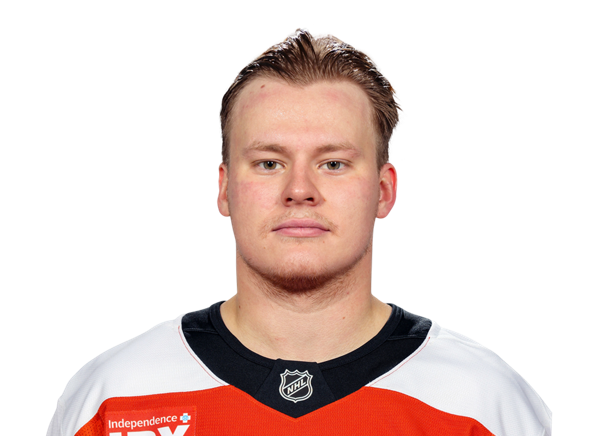
Matvei Michkov
#74
Owen Tippett
Goaltenders
#79
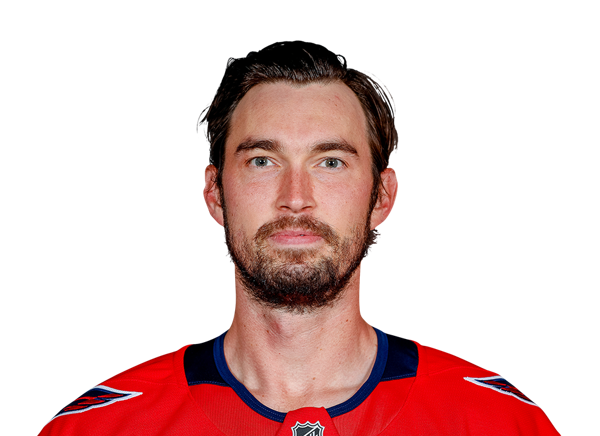
Charlie Lindgren
#48
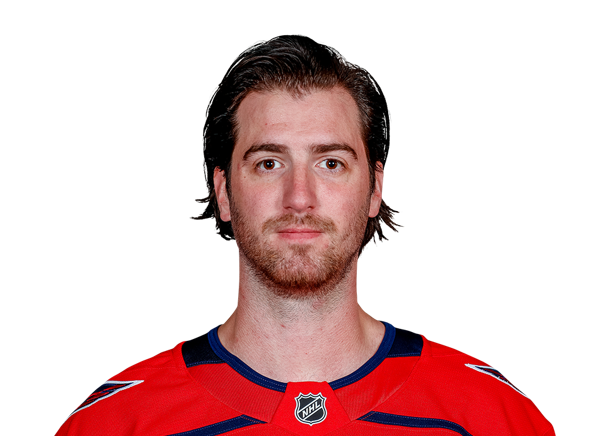
Logan Thompson
Defensemen
#6
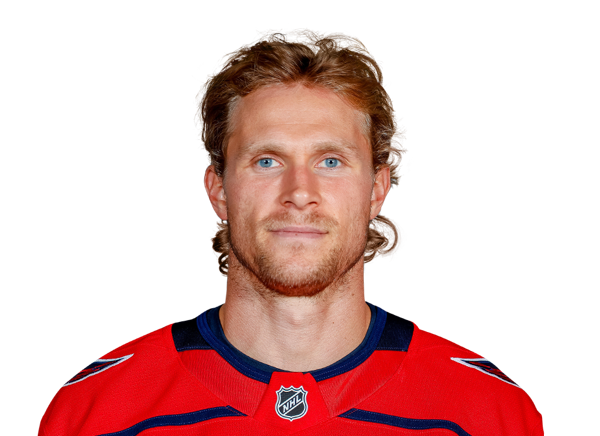
Jakob Chychrun
#73

Vincent Desharnais
#42
Martin Fehervary
#4
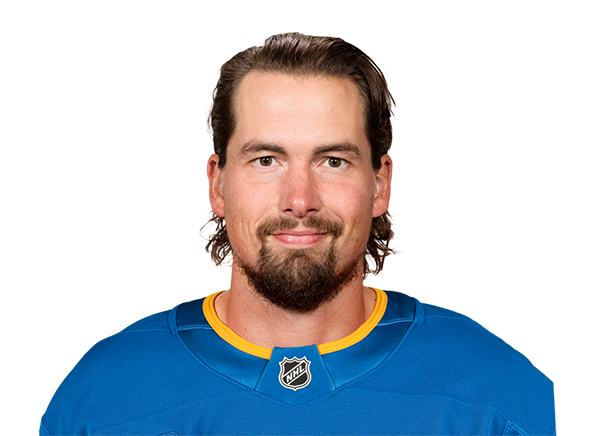
Justin Holl
#44
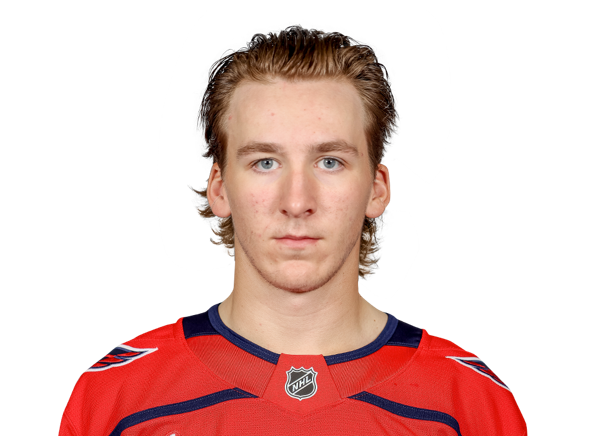
Cole Hutson
#27

Timothy Liljegren
#3
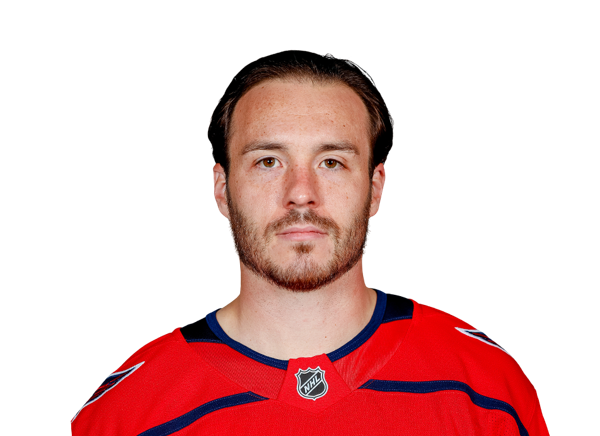
Matt Roy
#38
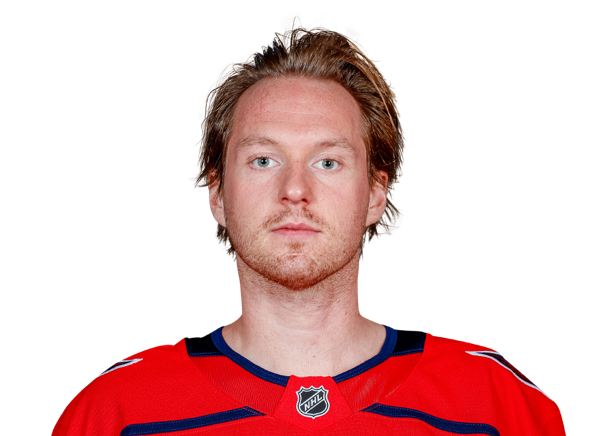
Rasmus Sandin
#29

Jack St. Ivany
Left Wings
#72

Anthony Beauvillier
#80
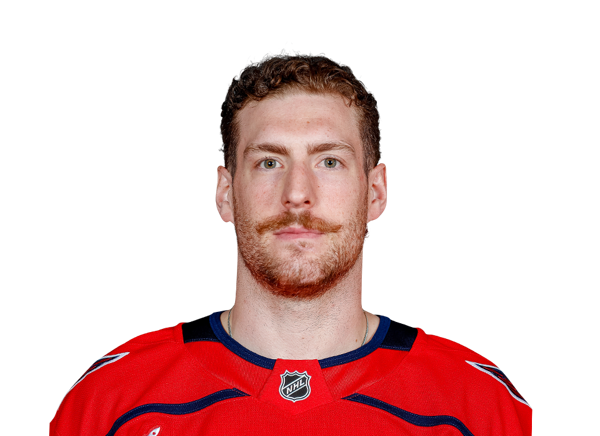
Pierre-Luc Dubois
#63
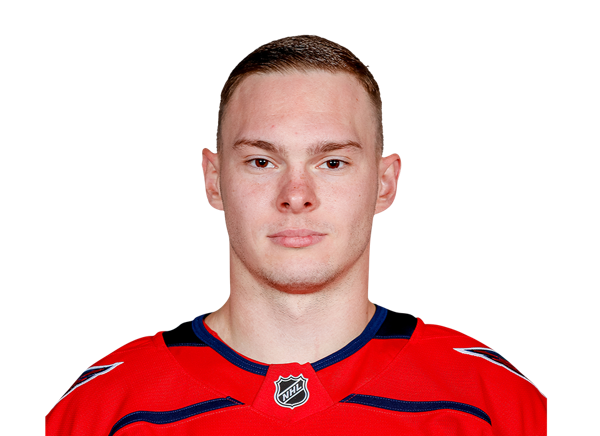
Ivan Miroshnichenko
#8
Alex Ovechkin
#62

Ilya Protas
Centers
#53

Ethen Frank
#22

Boone Jenner
#21
Aliaksei Protas
#17
Dylan Strome
#49
Patrick Thomas
Right Wings
#25
Jordan Kyrou
#9

Ryan Leonard
#34

Justin Sourdif
#89

Alex Tuch
#43
Tom Wilson
Flyers
6th in Metropolitan Division
VS
Capitals
4th in Metropolitan Division
General
20
Games Played
16
7147:32
Time On Ice
5667:31
357:22
Time On Ice Per Game
354:13
0
Plus/Minus Rating
0
0:00
Production
0:00
7637
Shifts
5627
10
Losses
6
5
Wins
10
Offensive
45
Goals
56
79
Assists
90
575
Faceoffs Won
429
560
Faceoffs Lost
470
0
Game-Winning Goals
0
124
Points
146
11
Power Play Goals
8
22
Power Play Assists
14
2
Short Handed Goals
1
1
Short Handed Assists
0
475
Shots
434
5
Shootout Attempts
0
1
Shootout Goals
0
20.0
Shootout Shot Percentage
0.0
9.5
Shooting Percentage
12.9
50.7
Faceoff Win Percent
47.7
Defensive
3.25
Goals Against Average
3.31
507
Saves
389
.891
Save Percentage
.888
65
Goals Against
53
572
Shots Against
442
5
Overtime Losses
0
3
Shootout Saves
0
5
Shootout Shots Against
0
.600
Shootout Save Percentage
.000
Penalties
190
Penalty Minutes
168