

Aces vs Valkyries Live Score (14 Oct, 2026)
Game Information
League
WNBA
Stage
Postseason
Season
2026
Date
October 14, 2026
Tipoff
12:00 AM EDT
Status
Scheduled
Venue
Chase Center
Location
San Francisco, CA
Team Stats
 LV
Game Comparison
GS
-Points-
-Rebounds-
-Assists-
49Field Goal %42
-3-Point %-
-Free Throw %-
Game Leaders
LVGS
 —#
Points
—
—#
—#
Rebounds
—
—#
—#
Assists
—
—#
Injury Report

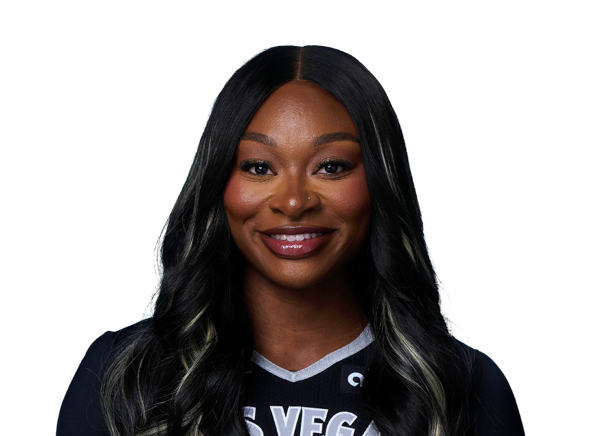
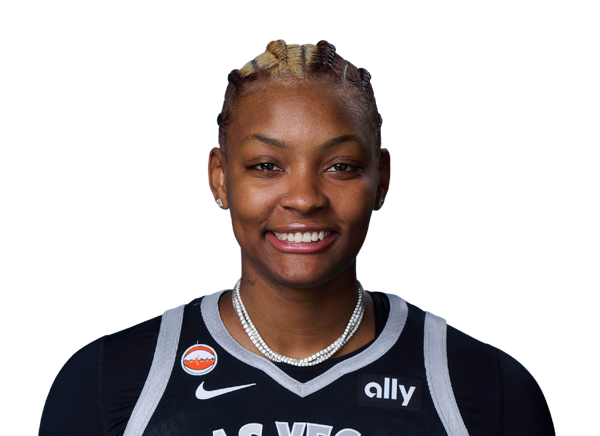
Golden State Valkyries
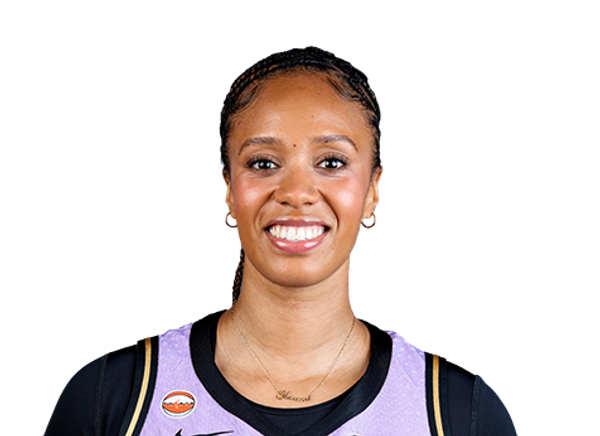
H2H / Season Series
No previous meetings found
Last 5 Games

WNBA Standings
Women's National Basketball Assoc. — Western Conference
| Team | W | L | PCT | GB | STRK |
|---|---|---|---|---|---|
 Minnesota | 33 | 11 | .750 | - | W1 |
| Golden State | 32 | 12 | .727 | 1 | W1 |
| Las Vegas | 31 | 13 | .705 | 2 | W7 |
 Dallas | 27 | 17 | .614 | 6 | W1 |
 Portland | 17 | 27 | .386 | 16 | W1 |
 Los Angeles | 16 | 28 | .364 | 17 | L2 |
 Phoenix | 16 | 28 | .364 | 17 | L1 |
 Seattle | 8 | 36 | .182 | 25 | L5 |
Rosters
Aces
3rd in Western Conference Division
VS
Valkyries
1st in Western Conference Division
Center

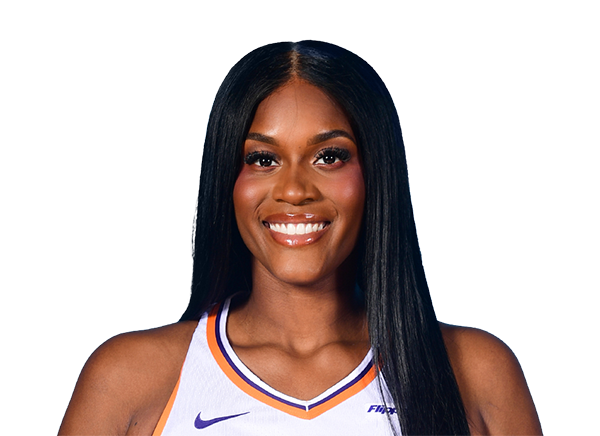
Guard
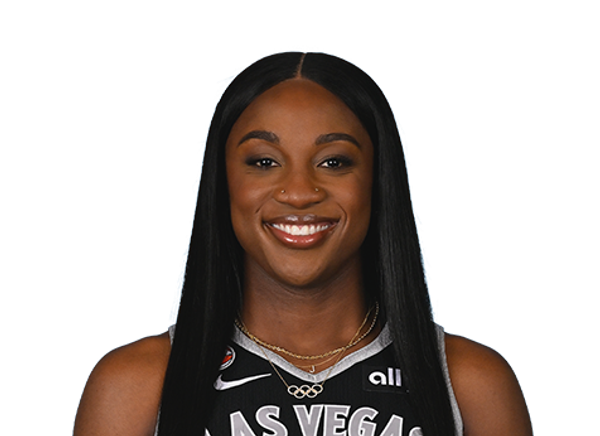
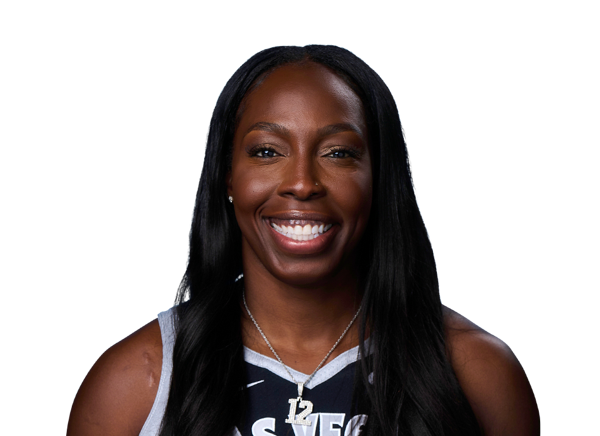
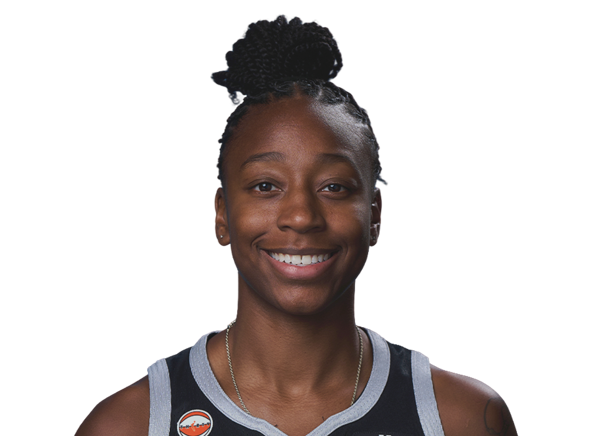
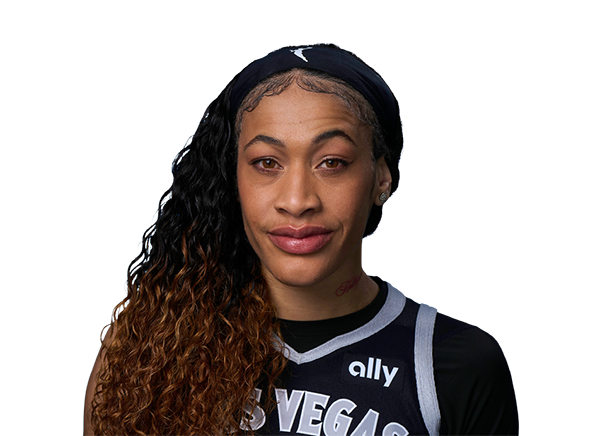

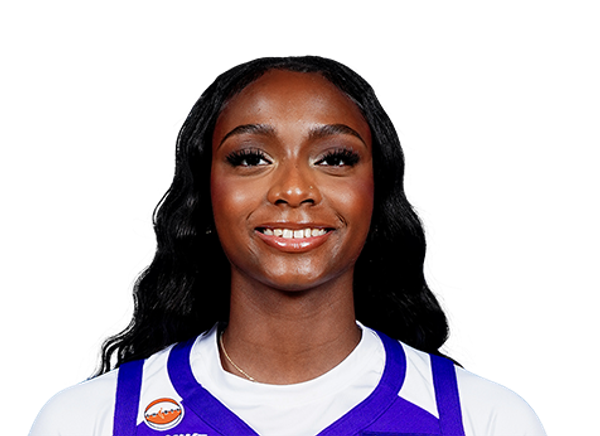
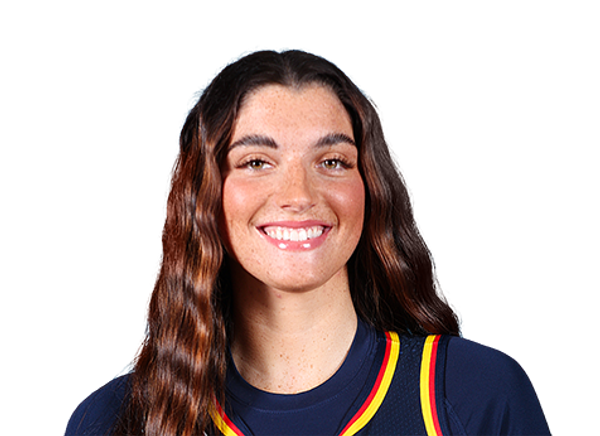
Forward

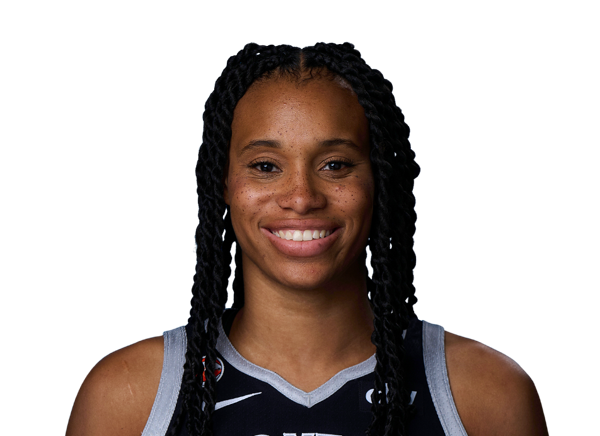
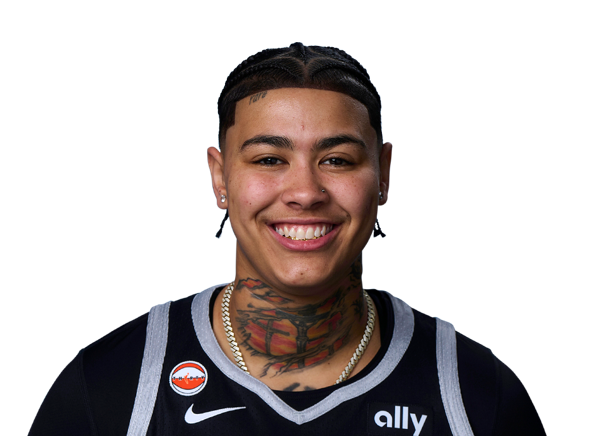
Forward

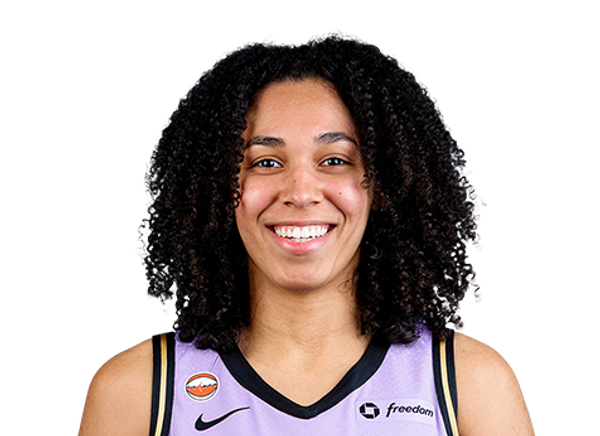


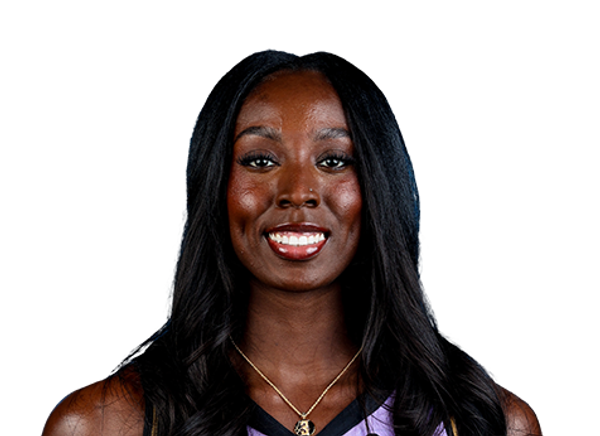
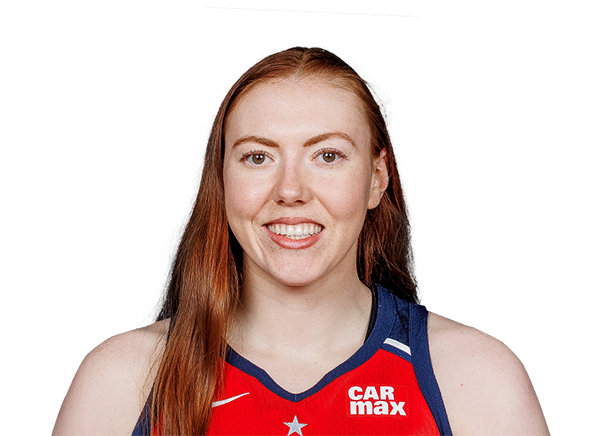
Guard
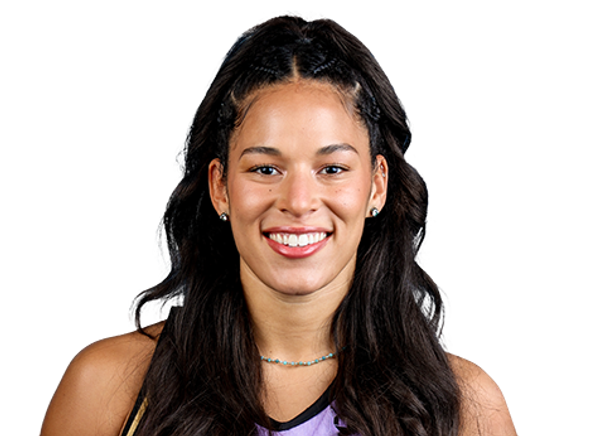


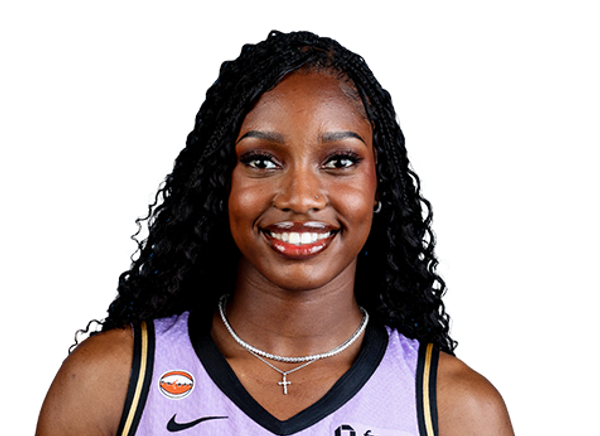

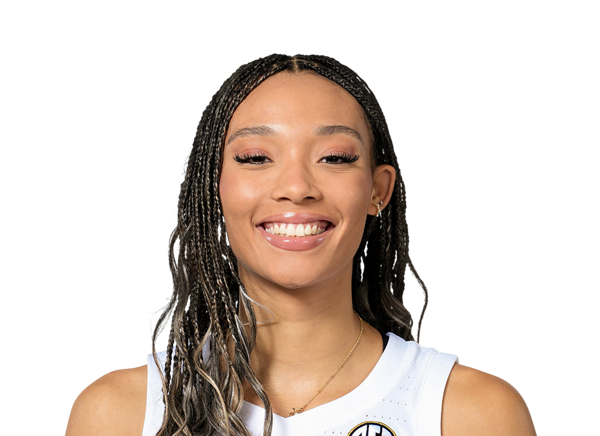
Center
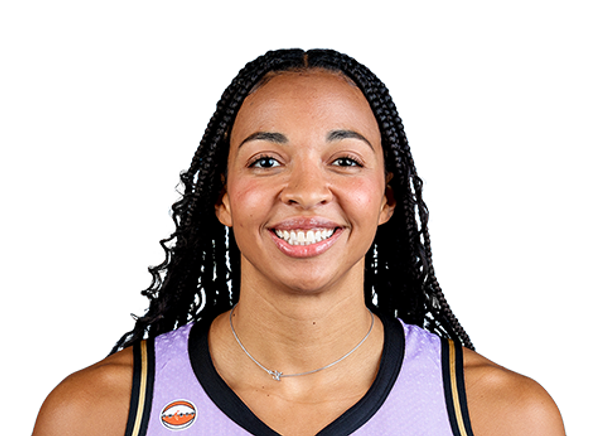
Team Statistics
Aces
3rd in Western Conference Division
VS
Valkyries
1st in Western Conference Division
General
33.4
Rebounds Per Game
33.3
1.8
Assist To Turnover Ratio
1.9
17.3
Fouls Per Game
19.2
44
Games Played
44
0
Games Started
0
0.0
Minutes Per Game
0.0
1471
Rebounds
1464
1471
Rebounds
1464
Offensive
81.4
Free Throw Percentage
77.4
36.2
3-Point Field Goal Percentage
34.4
33.3
Average Field Goals Made
28.7
68.4
Average Field Goals Attempted
68.0
8.7
Average 3-Point Field Goals Made
10.4
24.0
Average 3-Point Field Goals Attempted
30.3
16.3
Average Free Throws Made
14.3
20.0
Average Free Throws Attempted
18.4
91.5
Points Per Game
82.2
7.6
Offensive Rebounds Per Game
9.1
22.0
Assists Per Game
19.3
12.0
Turnovers Per Game
10.4
55.3
2-Point Field Goal Percentage
48.6
1.338
Scoring Efficiency
1.208
0.55
Shooting Efficiency
0.50
48.6
Field Goal Percentage
42.2
1081.0
2-Point Field Goals Made
805.0
1954.0
2-Point Field Goals Attempted
1658.0
4025
Points
3615
333
Offensive Rebounds
400
970
Assists
851
527
Turnovers
456
1463
Field Goals Made
1264
3008
Field Goals Attempted
2993
717
Free Throws Made
628
881
Free Throws Attempted
811
382
3-Point Field Goals Made
459
1054
3-Point Field Goals Attempted
1335
36.2
3-Point Field Goal Percentage
34.4
24.6
2-Point Field Goals Made per Game
18.3
44.4
2-Point Field Goals Attempted per Game
37.7
Defensive
25.9
Defensive Rebounds Per Game
24.2
4.9
Blocks Per Game
4.0
7.2
Steals Per Game
7.8
1138
Defensive Rebounds
1064
318
Steals
344
216
Blocks
178