

Heat vs Magic Live Score (13 Feb, 2027)
Game Information
League
NBA
Season
1
Date
February 12, 2027
Tipoff
7:00 PM EST
Status
Scheduled
Team Stats
 MIA
Game Comparison
ORL
-Points-
-Rebounds-
-Assists-
47Field Goal %45
-3-Point %-
-Free Throw %-
Game Leaders
MIAORL
 —#
Points
—
—#
—#
Rebounds
—
—#
—#
Assists
—
—#
Injury Report
Miami Heat
H2H / Season Series
Last 5 Games







NBA Standings
Eastern Conference — Southeast
| Team | W | L | PCT | GB | STRK |
|---|---|---|---|---|---|
 Atlanta | 7 | 6 | .538 | - | L2 |
| Miami | 6 | 6 | .500 | 0.5 | W3 |
| Orlando | 5 | 7 | .417 | 1.5 | W3 |
 Charlotte | 4 | 8 | .333 | 2.5 | L1 |
 Washington | 4 | 9 | .308 | 3 | L6 |
Rosters
Heat
4th in Eastern Conference Division
VS
Magic
8th in Eastern Conference Division
Forward
#7
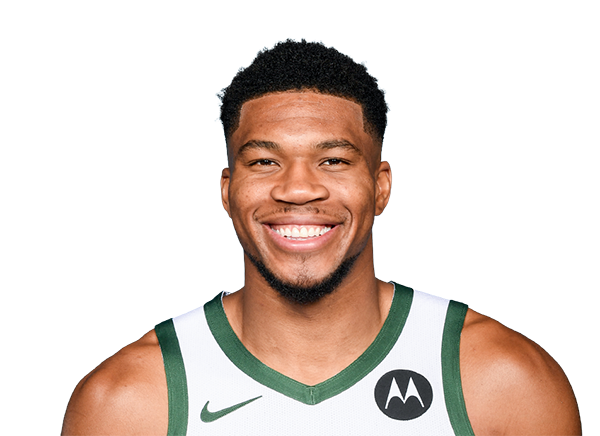
Giannis Antetokounmpo
#22

Andrew Wiggins
#95

Bobby Portis
#5

Nikola Jovic
#15

Myron Gardner

Simone Fontecchio
#16

Keshad Johnson
Center
#13

Bam Adebayo
#8

Nick Richards
Guard
#2

Davion Mitchell
#11
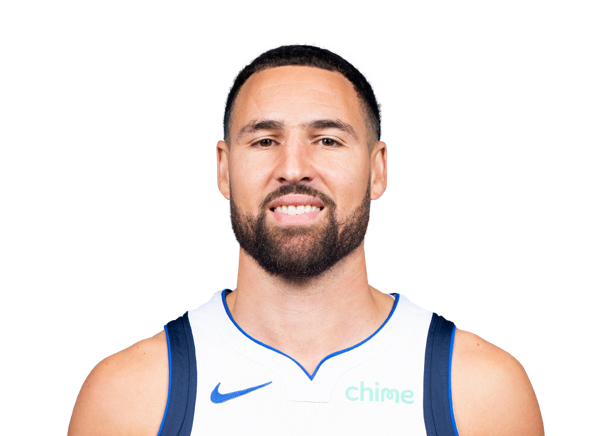
Klay Thompson
#9

Pelle Larsson
#4

Ryan Conwell
#10

Tim Hardaway Jr.
#12

Dru Smith
#24
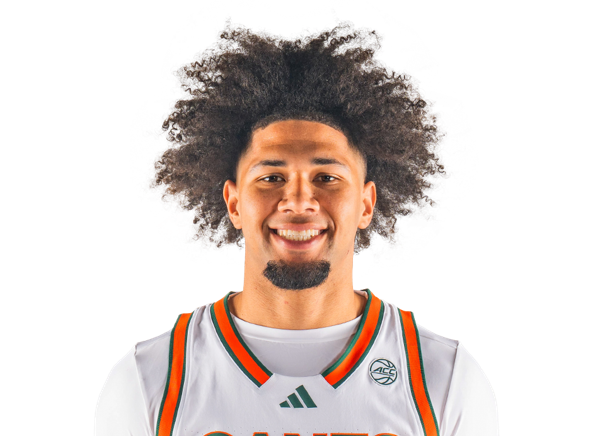
Tre Donaldson
Forward
#22

Franz Wagner
#23

Tristan da Silva
#8

Jamal Cain
#5

Paolo Banchero
#1

Jonathan Isaac
#93
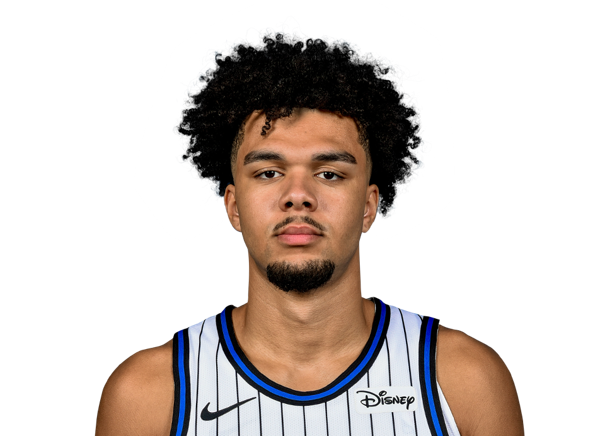
Noah Penda
#25

Izaiyah Nelson
Guard
#3

Desmond Bane
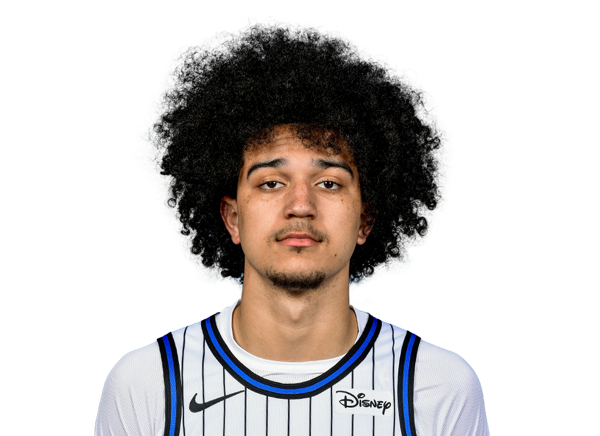
Anthony Black
#11
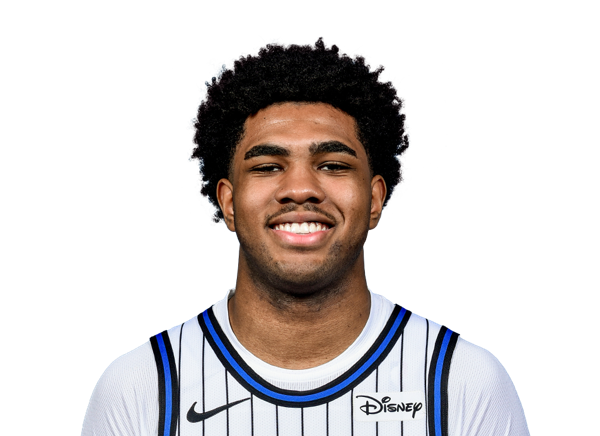
Jase Richardson
#2

Jevon Carter
#30

Alex Morales
#4

Jalen Suggs
Center
#34

Wendell Carter Jr.
#35

Goga Bitadze
#9

Nikola Vucevic
#14

Colin Castleton
Team Statistics
Heat
4th in Eastern Conference Division
VS
Magic
8th in Eastern Conference Division
General
42.8
Rebounds Per Game
42.9
2.2
Assist To Turnover Ratio
1.6
21.1
Fouls Per Game
22.8
13
Games Played
12
0
Games Started
0
0
Minutes
0
0.0
Minutes Per Game
0.0
556
Rebounds
515
556
Rebounds
515
Offensive
74.0
Free Throw Percentage
78.2
34.1
3-Point Field Goal Percentage
33.7
42.0
Average Field Goals Made
38.4
89.5
Average Field Goals Attempted
85.8
13.5
Average 3-Point Field Goals Made
13.8
39.5
Average 3-Point Field Goals Attempted
41.1
21.2
Average Free Throws Made
17.7
28.7
Average Free Throws Attempted
22.6
118.7
Points Per Game
108.3
10.5
Offensive Rebounds Per Game
11.0
29.8
Assists Per Game
26.0
13.8
Turnovers Per Game
16.0
57.1
2-Point Field Goal Percentage
54.9
1.327
Scoring Efficiency
1.262
0.54
Shooting Efficiency
0.53
46.9
Field Goal Percentage
44.8
371.0
2-Point Field Goals Made
295.0
650.0
2-Point Field Goals Attempted
537.0
1543
Points
1300
137
Offensive Rebounds
132
387
Assists
312
180
Turnovers
192
546
Field Goals Made
461
1163
Field Goals Attempted
1030
276
Free Throws Made
212
373
Free Throws Attempted
271
175
3-Point Field Goals Made
166
513
3-Point Field Goals Attempted
493
34.1
3-Point Field Goal Percentage
33.7
28.5
2-Point Field Goals Made per Game
24.6
50.0
2-Point Field Goals Attempted per Game
44.8
Defensive
32.2
Defensive Rebounds Per Game
31.9
5.5
Blocks Per Game
4.1
7.8
Steals Per Game
7.4
419
Defensive Rebounds
383
101
Steals
89
72
Blocks
49