

Spurs vs Magic Live Score (14 Feb, 2027)
Game Information
League
NBA
Season
1
Date
February 13, 2027
Tipoff
7:00 PM EST
Status
Scheduled
Team Stats
 SA
Game Comparison
ORL
-Points-
-Rebounds-
-Assists-
47Field Goal %45
-3-Point %-
-Free Throw %-
Game Leaders
SAORL
 —#
Points
—
—#
—#
Rebounds
—
—#
—#
Assists
—
—#
Injury Report
H2H / Season Series
Last 5 Games







NBA Standings
Western Conference — Southwest
| Team | W | L | PCT | GB | STRK |
|---|---|---|---|---|---|
| San Antonio | 12 | 2 | .857 | - | W12 |
 Houston | 11 | 3 | .786 | 1 | W4 |
 Memphis | 9 | 4 | .692 | 2.5 | W2 |
 Dallas | 7 | 7 | .500 | 5 | L3 |
 New Orleans | 4 | 10 | .286 | 8 | L6 |
Eastern Conference — Southeast
| Team | W | L | PCT | GB | STRK |
|---|---|---|---|---|---|
 Atlanta | 8 | 6 | .571 | - | W1 |
 Miami | 7 | 6 | .538 | 0.5 | W4 |
| Orlando | 5 | 7 | .417 | 2 | W3 |
 Charlotte | 4 | 9 | .308 | 3.5 | L2 |
 Washington | 4 | 10 | .286 | 4 | L7 |
Rosters
Spurs
1st in Western Conference Division
VS
Magic
8th in Eastern Conference Division
Forward
#1
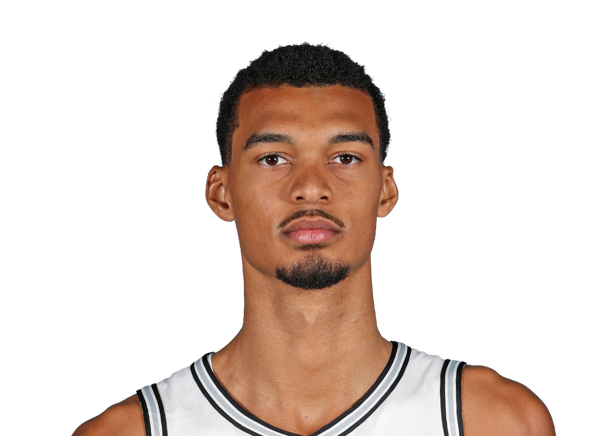
Victor Wembanyama
#30

Julian Champagnie
#3
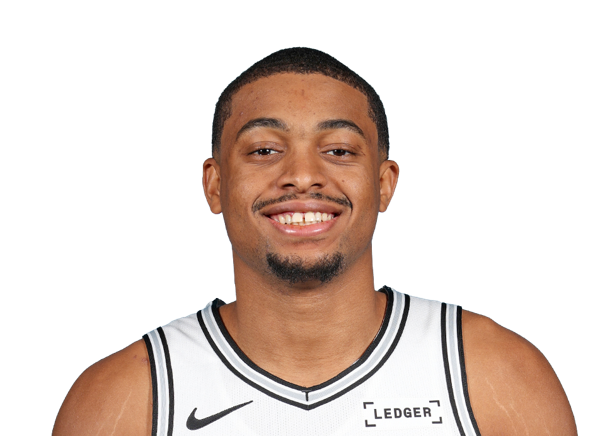
Keldon Johnson
#40
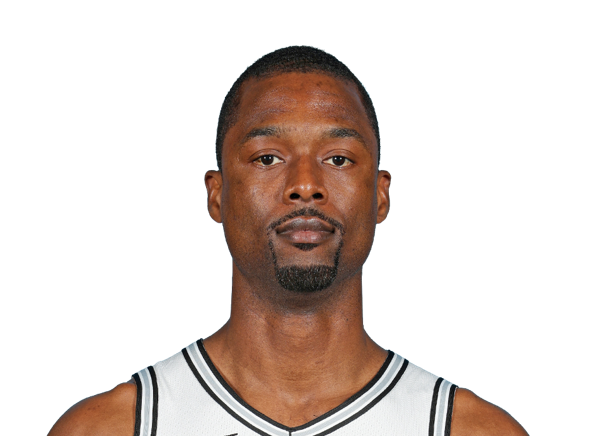
Harrison Barnes
#11
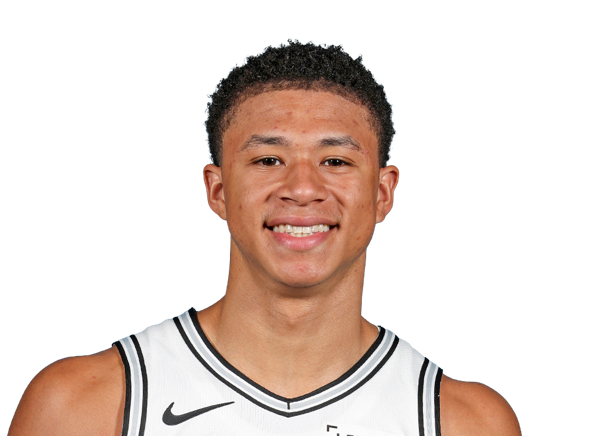
Carter Bryant
#25
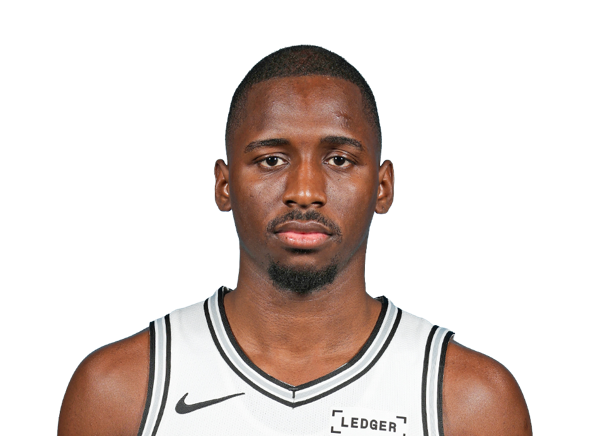
David Jones Garcia
#15
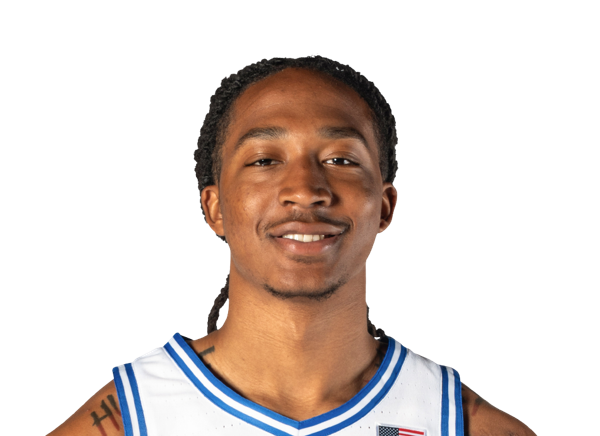
Maliq Brown
#23
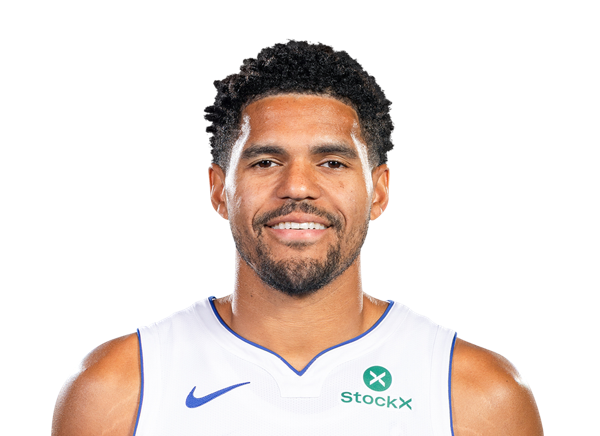
Tobias Harris
#22
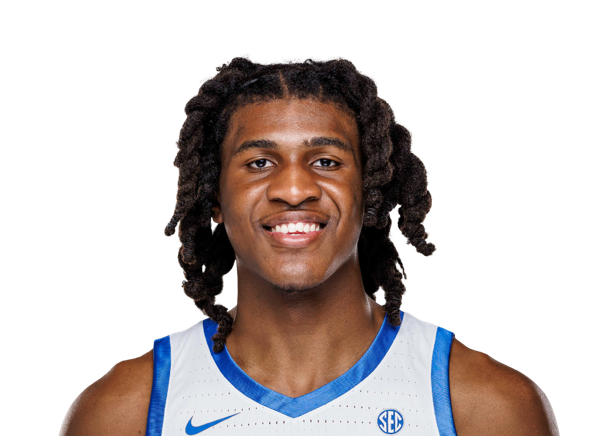
Jayden Quaintance
Guard
#2
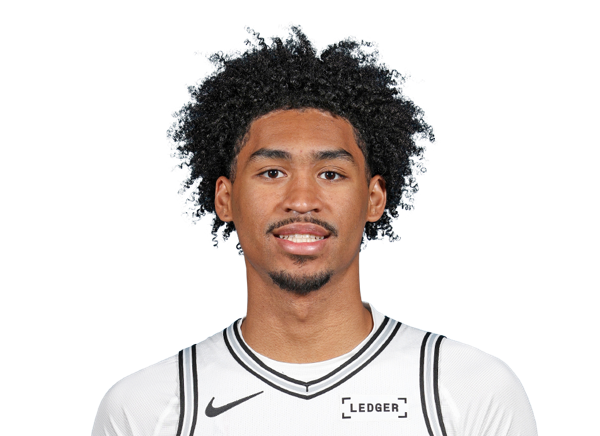
Dylan Harper
#5
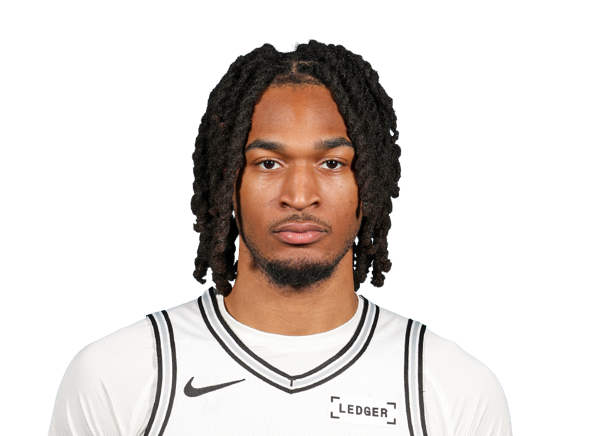
Stephon Castle
#4
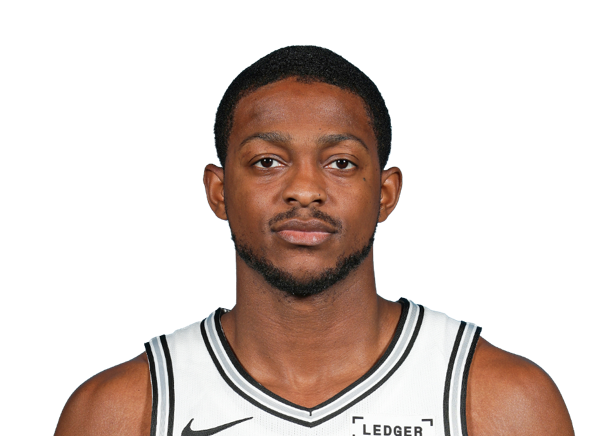
De'Aaron Fox
#24

Devin Vassell
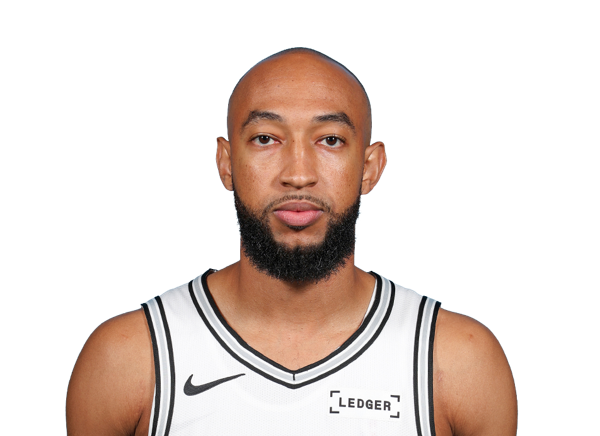
Jordan McLaughlin
#17
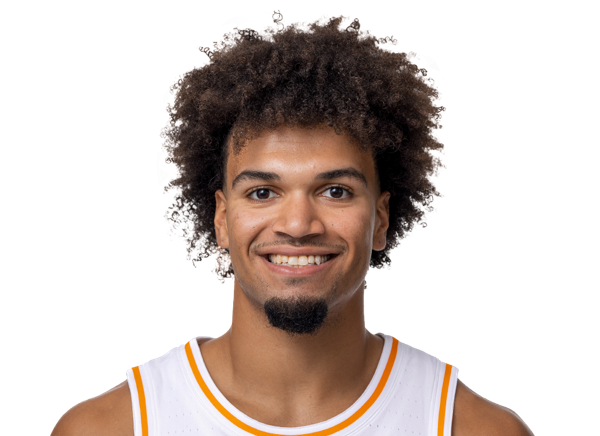
Ja'Kobi Gillespie
Center
#7
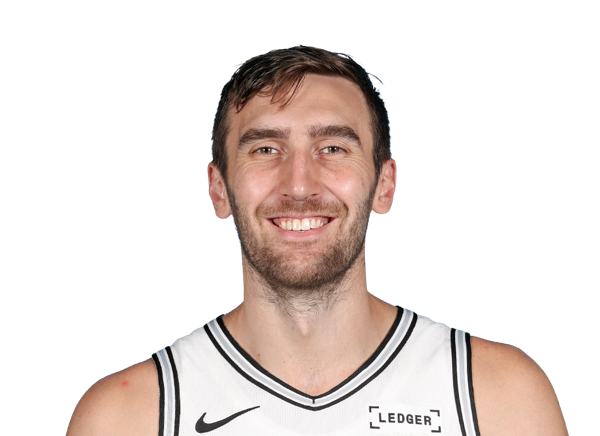
Luke Kornet
#10
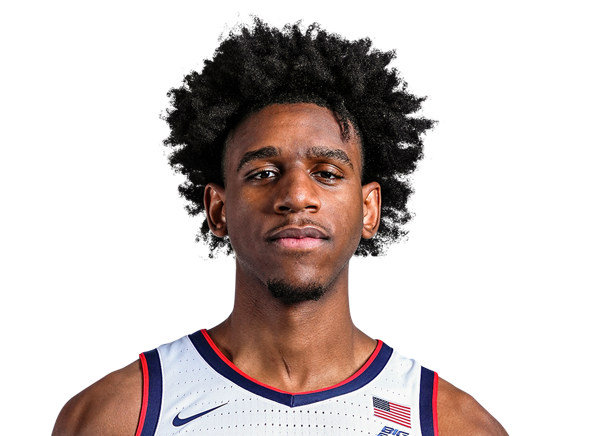
Tarris Reed Jr.
Forward
#22

Franz Wagner
#23
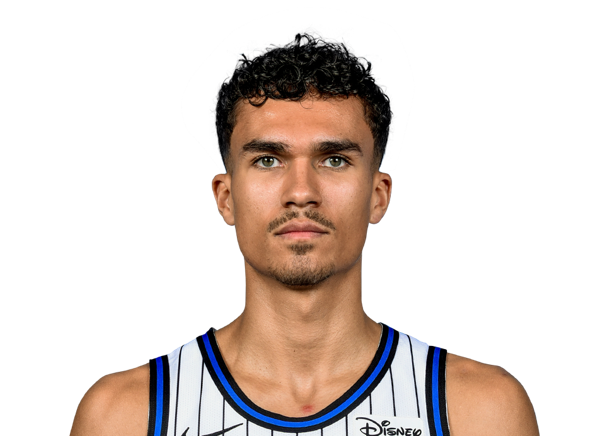
Tristan da Silva
#8

Jamal Cain
#5

Paolo Banchero
#1

Jonathan Isaac
#93
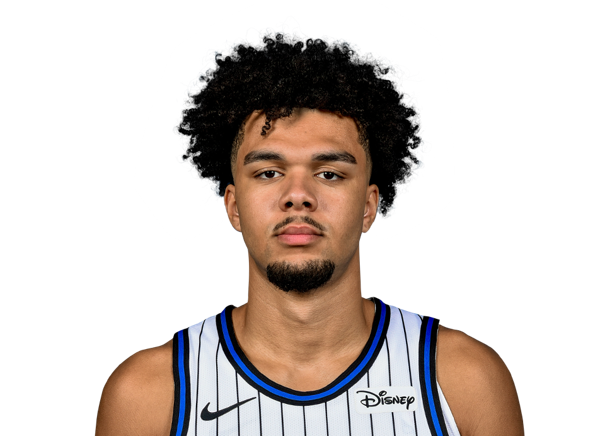
Noah Penda
#25
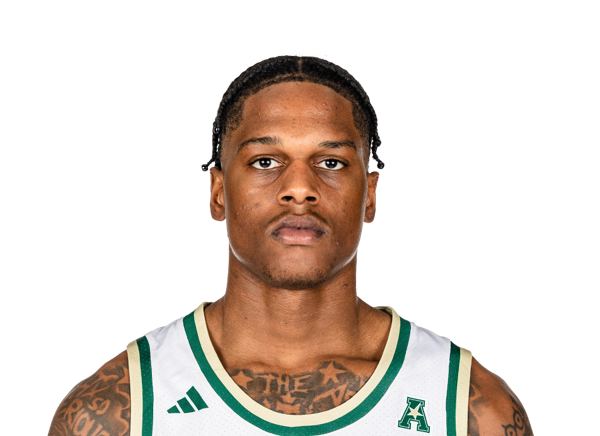
Izaiyah Nelson
Guard
#3

Desmond Bane
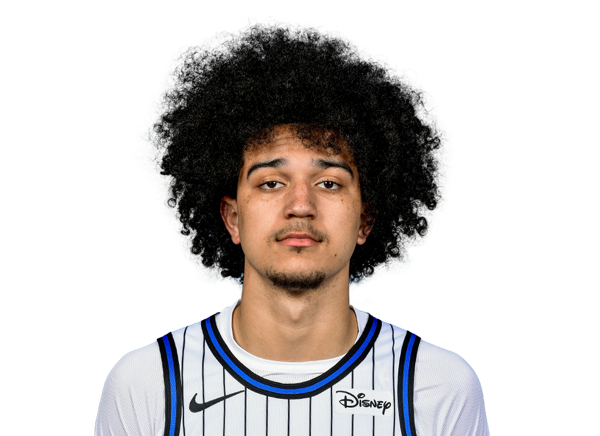
Anthony Black
#11
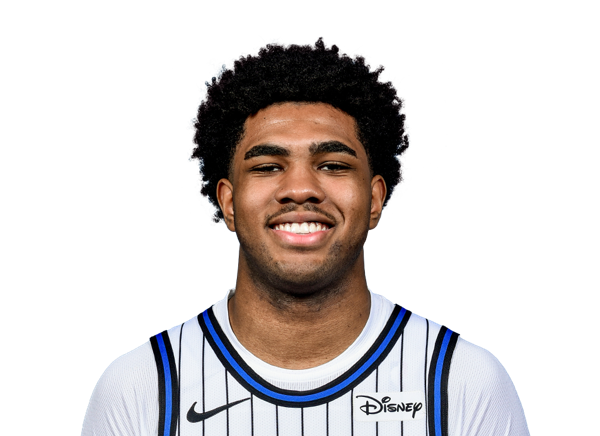
Jase Richardson
#2
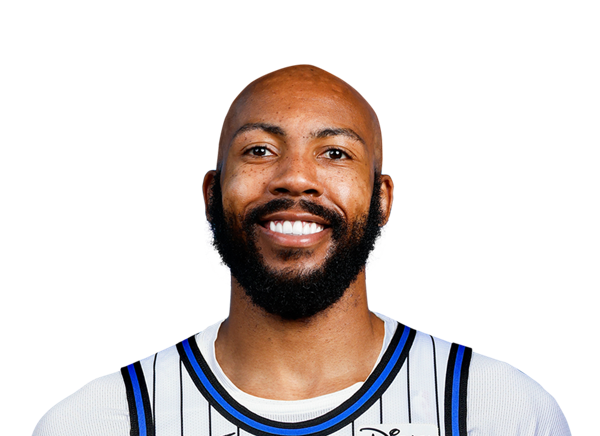
Jevon Carter
#30

Alex Morales
#4

Jalen Suggs
Center
#34
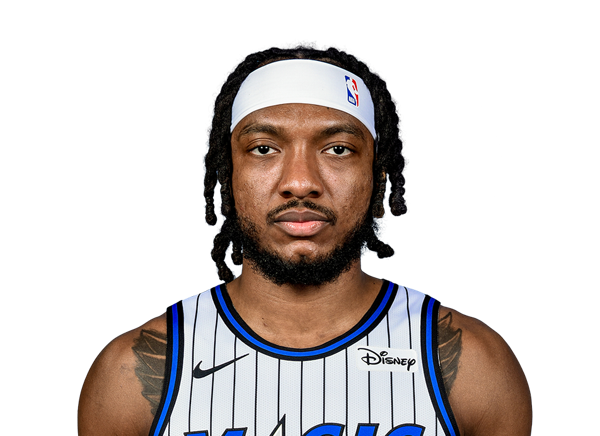
Wendell Carter Jr.
#35
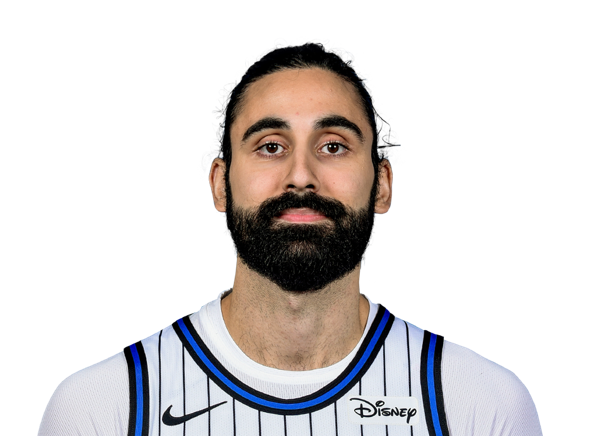
Goga Bitadze
#9

Nikola Vucevic
#14

Colin Castleton
Team Statistics
Spurs
1st in Western Conference Division
VS
Magic
8th in Eastern Conference Division
General
48.6
Rebounds Per Game
42.9
2.4
Assist To Turnover Ratio
1.6
19.4
Fouls Per Game
22.8
14
Games Played
12
0
Games Started
0
0
Minutes
0
0.0
Minutes Per Game
0.0
680
Rebounds
515
680
Rebounds
515
Offensive
80.5
Free Throw Percentage
78.2
34.4
3-Point Field Goal Percentage
33.7
42.8
Average Field Goals Made
38.4
91.5
Average Field Goals Attempted
85.8
12.3
Average 3-Point Field Goals Made
13.8
35.7
Average 3-Point Field Goals Attempted
41.1
20.9
Average Free Throws Made
17.7
26.0
Average Free Throws Attempted
22.6
118.8
Points Per Game
108.3
12.9
Offensive Rebounds Per Game
11.0
28.0
Assists Per Game
26.0
11.6
Turnovers Per Game
16.0
54.7
2-Point Field Goal Percentage
54.9
1.298
Scoring Efficiency
1.262
0.53
Shooting Efficiency
0.53
46.8
Field Goal Percentage
44.8
427.0
2-Point Field Goals Made
295.0
781.0
2-Point Field Goals Attempted
537.0
1663
Points
1300
181
Offensive Rebounds
132
392
Assists
312
163
Turnovers
192
599
Field Goals Made
461
1281
Field Goals Attempted
1030
293
Free Throws Made
212
364
Free Throws Attempted
271
172
3-Point Field Goals Made
166
500
3-Point Field Goals Attempted
493
34.4
3-Point Field Goal Percentage
33.7
30.5
2-Point Field Goals Made per Game
24.6
55.8
2-Point Field Goals Attempted per Game
44.8
Defensive
35.6
Defensive Rebounds Per Game
31.9
7.1
Blocks Per Game
4.1
8.6
Steals Per Game
7.4
499
Defensive Rebounds
383
120
Steals
89
100
Blocks
49